Note
Click here to download the full example code
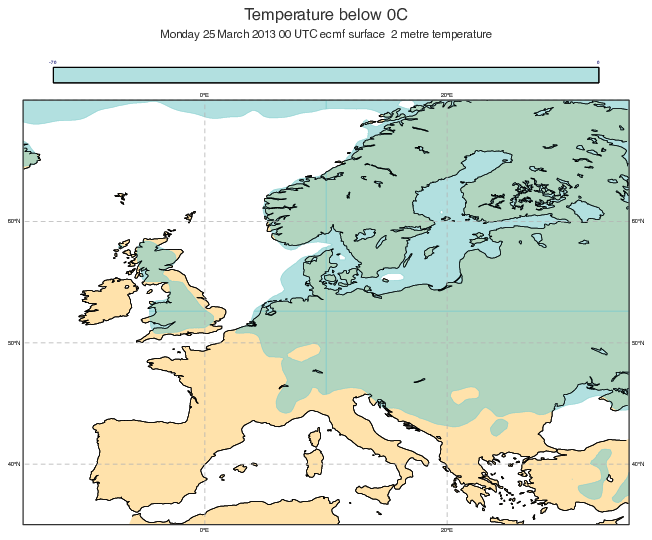
GRIB - Temperature Below 0 Celsius
# (C) Copyright 2017- ECMWF.
#
# This software is licensed under the terms of the Apache Licence Version 2.0
# which can be obtained at http://www.apache.org/licenses/LICENSE-2.0.
#
# In applying this licence, ECMWF does not waive the privileges and immunities
# granted to it by virtue of its status as an intergovernmental organisation
# nor does it submit to any jurisdiction.
#

# -------------------------------------------------------------------------
# Demonstrates how to define a contour level list so that only
# field values in a certain range are coloured.
# -------------------------------------------------------------------------

import metview as mv

# read the input grib file
filename = "2m_temperature.grib"
if mv.exist(filename):
    my_data = mv.read(filename)
else:
    my_data = mv.gallery.load_dataset(filename)

# set up the background coastlines
my_background = mv.mcoast(
    map_label="ON",
    map_grid_line_style="DASH",
    map_grid_colour="GREY",
    map_coastline_colour="BLACK",
    map_coastline_land_shade="ON",
    map_coastline_land_shade_colour="CREAM",
)

# set up the geographical area
my_view = mv.geoview(
    map_area_definition="CORNERS",
    map_projection="CYLINDRICAL",
    area=[35, -15, 70, 35],
    coastlines=my_background,
)

# set up the contour so that only one level is coloured
my_contour = mv.mcont(
    contour_level_selection_type="LEVEL_LIST",
    contour_level_list=[-70.00, 0.00],
    contour_label="OFF",
    legend="ON",
    contour="OFF",
    contour_shade="ON",
    contour_shade_colour_method="LIST",
    contour_shade_method="AREA_FILL",
    contour_shade_colour_direction="ANTI_CLOCKWISE",
    contour_shade_colour_list=["rgba(0.498,0.8,0.8,0.6)"],
)

# set-up the title
my_title = mv.mtext(
    text_font_size=0.5,
    text_lines=["<font size='0.7'>Temperature below 0C</font>", "<magics_title/>", ""],
    text_colour="CHARCOAL",
)

# define the output plot file
mv.setoutput(mv.pdf_output(output_name="contour10"))

# plot the data onto the map
mv.plot(my_view, my_data, my_contour, my_title)