Note
Click here to download the full example code
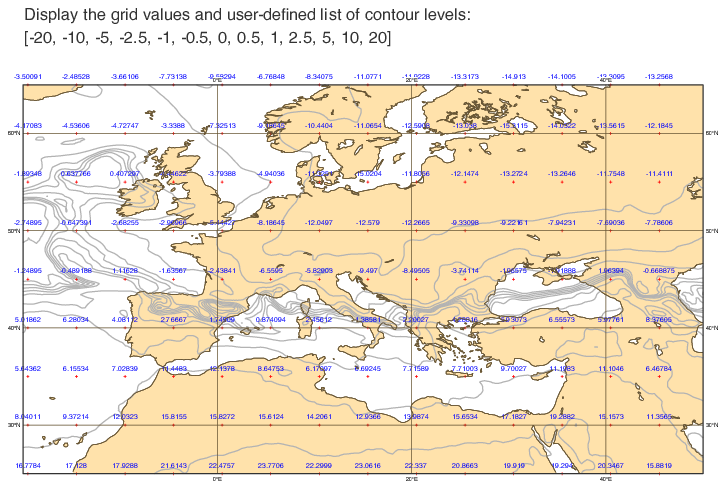
GRIB - Grid Values and Contour Levels
# (C) Copyright 2017- ECMWF.
#
# This software is licensed under the terms of the Apache Licence Version 2.0
# which can be obtained at http://www.apache.org/licenses/LICENSE-2.0.
#
# In applying this licence, ECMWF does not waive the privileges and immunities
# granted to it by virtue of its status as an intergovernmental organisation
# nor does it submit to any jurisdiction.
#

# ------------------------------------------------------------------------
# Demonstrates how to show the field grid values and define a
# list of contour levels.
# ------------------------------------------------------------------------

import metview as mv

# read the input grib file
filename = "t850.grb"
if mv.exist(filename):
    my_data = mv.read(filename)
else:
    my_data = mv.gallery.load_dataset(filename)

# set up the coastlines
my_coast = mv.mcoast(
    map_coastline_land_shade_colour="CREAM",
    map_grid_colour="TAN",
    map_grid="ON",
    map_coastline_colour="TAN",
    map_coastline_land_shade="ON",
)

# set up the geographical view
my_view = mv.geoview(
    map_area_definition="CORNERS",
    map_projection="CYLINDRICAL",
    area=[25.00, -20.00, 65.00, 50.00],
    coastlines=my_coast,
)

# set up the contour so that grid values are shown
my_contour = mv.mcont(
    contour_grid_value_plot="ON",
    contour_level_selection_type="LEVEL_LIST",
    contour_level_list=[-20, -10, -5, -2.5, -1, -0.5, 0, 0.5, 1, 2.5, 5, 10, 20],
    contour_grid_value_height=0.30,
    contour_grid_value_plot_type="BOTH",
    contour_grid_value_marker_height=0.20,
    contour_line_colour="GREY",
    contour_highlight="OFF",
    contour_line_thickness=2,
    contour_label="OFF",
    contour_grid_value_lon_frequency=10,
    contour_grid_value_lat_frequency=10,
    legend="OFF",
)

# set-up the title
my_title = mv.mtext(
    text_font_size=0.70,
    text_lines=[
        "Display the grid values and user-defined list of contour levels:",
        "[-20, -10, -5, -2.5, -1, -0.5, 0, 0.5, 1, 2.5, 5, 10, 20]",
        "",
    ],
    text_justification="LEFT",
    text_colour="CHARCOAL",
)


# define the output plot file
mv.setoutput(mv.pdf_output(output_name="contour3"))

# plot the data onto the map
mv.plot(my_view, my_data, my_contour, my_title)