Note
Click here to download the full example code
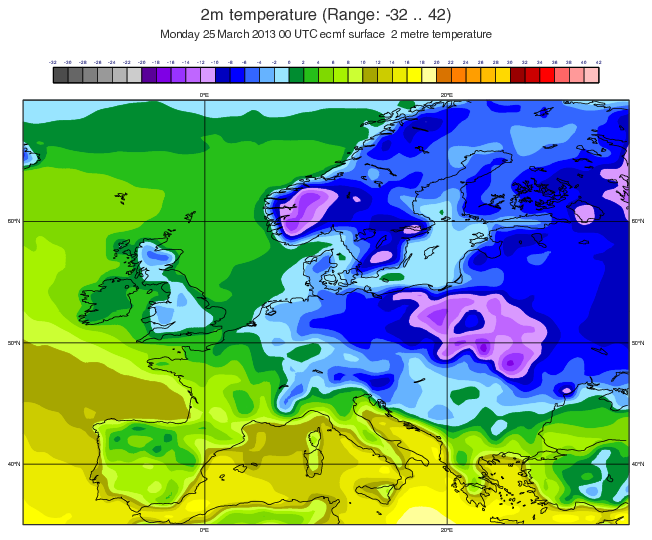
GRIB - Interval Shading Contour
# (C) Copyright 2017- ECMWF.
#
# This software is licensed under the terms of the Apache Licence Version 2.0
# which can be obtained at http://www.apache.org/licenses/LICENSE-2.0.
#
# In applying this licence, ECMWF does not waive the privileges and immunities
# granted to it by virtue of its status as an intergovernmental organisation
# nor does it submit to any jurisdiction.
#

# ----------------------------------------------------------------------------------
# Demonstrates how to define a shading contour using an interval range.
# ----------------------------------------------------------------------------------

import metview as mv

# read the input grib file
filename = "2m_temperature.grib"
if mv.exist(filename):
    my_data = mv.read(filename)
else:
    my_data = mv.gallery.load_dataset(filename)

# set up the geographical area
my_view = mv.geoview(
    map_area_definition="CORNERS", map_projection="CYLINDRICAL", area=[35, -15, 70, 35]
)

# set up the coastlines
my_coast = mv.mcoast(
    map_coastline_land_shade="ON", map_coastline_land_shade_colour="CREAM"
)

# set up the contour using an interval range
my_contour = mv.mcont(
    contour_level_selection_type="INTERVAL",
    contour_interval=2.00,
    contour_shade_method="AREA_FILL",
    contour_shade="ON",
    contour_shade_max_level=42.00,
    contour_shade_min_level=-32.00,
    contour_highlight_thickness=5,
    contour_line_thickness=3,
    contour_label="OFF",
    contour_highlight_frequency=100,
    legend="ON",
    contour_hilo="OFF",
    contour="OFF",
    contour_shade_colour_method="LIST",
    contour_shade_colour_list=[
        "rgb(0.3,0.3,0.3)",
        "rgb(0.4,0.4,0.4)",
        "rgb(0.5,0.5,0.5)",
        "rgb(0.6,0.6,0.6)",
        "rgb(0.7,0.7,0.7)",
        "rgb(0.8,0.8,0.8)",
        "rgb(0.35,0,0.6)",
        "rgb(0.5,0,0.9)",
        "rgb(0.6,0.2,1)",
        "rgb(0.75,0.4,1)",
        "rgb(0.85,0.6,1)",
        "rgb(0,0,0.75)",
        "rgb(0,0,1)",
        "rgb(0.2,0.4,1)",
        "rgb(0.4,0.7,1)",
        "rgb(0.6,0.9,1)",
        "rgb(0,0.55,0.19)",
        "rgb(0.15,0.75,0.1)",
        "rgb(0.5,0.85,0)",
        "rgb(0.65,0.95,0)",
        "rgb(0.8,1,0.2)",
        "rgb(0.65,0.65,0)",
        "rgb(0.8,0.8,0)",
        "rgb(0.92,0.92,0)",
        "rgb(1,1,0)",
        "rgb(1,1,0.6)",
        "rgb(0.85,0.45,0)",
        "rgb(1,0.5,0)",
        "rgb(1,0.62,0)",
        "rgb(1,0.74,0)",
        "rgb(1,0.85,0)",
        "rgb(0.6,0,0)",
        "rgb(0.8,0,0)",
        "rgb(1,0,0)",
        "rgb(1,0.4,0.4)",
        "rgb(1,0.6,0.6)",
        "rgb(1,0.75,0.75)",
    ],
)

# set-up the title
my_title = mv.mtext(
    text_font_size=0.50,
    text_lines=[
        "<font size='0.7'>2m temperature (Range: -32 .. 42)</font>",
        "<magics_title/>",
        "",
    ],
    text_colour="CHARCOAL",
)

# define the output plot file
mv.setoutput(mv.pdf_output(output_name="contour9"))

# plot the data onto the map
mv.plot(my_view, my_coast, my_data, my_contour, my_title)