Note
Click here to download the full example code
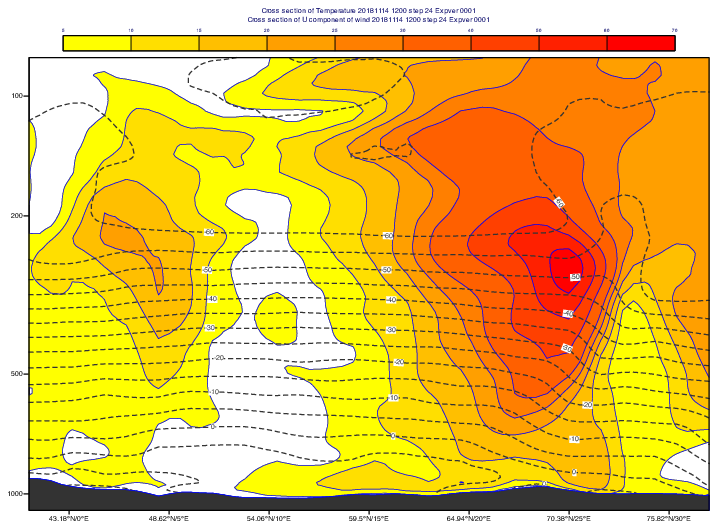
Cross Section for Model Level Data with Orography
# (C) Copyright 2017- ECMWF.
#
# This software is licensed under the terms of the Apache Licence Version 2.0
# which can be obtained at http://www.apache.org/licenses/LICENSE-2.0.
#
# In applying this licence, ECMWF does not waive the privileges and immunities
# granted to it by virtue of its status as an intergovernmental organisation
# nor does it submit to any jurisdiction.
#

import metview as mv

# read grib file - contains model level data
filename = "fc_ml.grib"
if mv.exist(filename):
    fs = mv.read(filename)
else:
    fs = mv.gallery.load_dataset(filename)

# read temperature and scale it to C
t = mv.read(data=fs, param="t")
t = t - 273.16

# read wind components and compute speed
u = mv.read(data=fs, param="u")
v = mv.read(data=fs, param="v")
sp = mv.sqrt(u * u + v * v)

# read log of surface pressure
lnsp = mv.read(data=fs, param="lnsp")

# define cross section line
line = [41, -2, 78, 32]

# define shading for wind speed
sp_cont = mv.mcont(
    legend="on",
    contour_automatics_settings="style_name",
    contour_style_name="sh_red_f5t70lst",
)

# define contouring for temperature
t_cont = mv.mcont(
    contour_line_style="dash",
    contour_line_thickness=2,
    contour_line_colour="charcoal",
    contour_highlight="off",
    contour_level_selection_type="interval",
    contour_interval=5,
)

# define cross section in log pressure from surface 80 hPa
xs_view = mv.mxsectview(line=line, top_level=80, vertical_scaling="log")

# define orography area
orog_graph = mv.mgraph(
    graph_type="area",
    graph_shade_colour="charcoal",
)

# define cross section data (field + lnsp)
xs_t_data = mv.merge(t, lnsp)
xs_sp_data = mv.merge(sp, lnsp)

# define the output plot file
mv.setoutput(mv.pdf_output(output_name="cross_section_orog"))

# generate plot
mv.plot(xs_view, xs_sp_data, sp_cont, xs_t_data, t_cont, orog_graph)