mxsectview

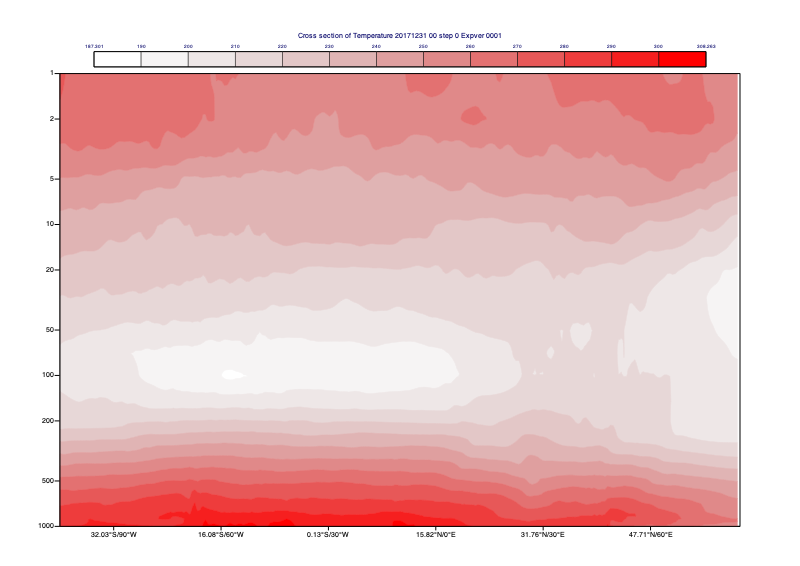
Specifies the view for cross section plots from a suitable GRIB data source . It can also take the output from mcross_sect() as an input. In this case, a consistency check is performed between the parameters that are common to both functions.
In addition to the parameters required for the cross section computation, mxsectview() specifies the axis details as well as the plot positioning in the plot frame of the display window/paper sheet and the overlay of different data units in the same plot.
When using mxsectview() the generated profile data cannot be accessed. If you need to access this data use mcross_sect() instead.
If an orography is plotted it can be customised by applying mgraph().
For further details on the role and usage of views in the visualisation process, please see Anaylis Views.
Note
This function performs the same task as the Cross Section View icon in Metview’s user interface. It accepts its parameters as keyword arguments, described below.
- mxsectview(**kwargs)
Defines the view for a vertical cross section.
- Parameters
line (list[number], default: [0, -180, 0, 180]) –
Specifies the coordinates of a transect line along which the cross-section is calculated in [lat1, lon1, lat2, lon2] format. The cross section is calculated from a set of geographical points taken along the input transect line. The point selection takes into consideration the resolution of the data and assures that a minimum of 64 points will be used. Note that it is possible to define a line through either poles by describing the line’s coordinates as follows:
First, when specifying the latitudes of the two points, imagine that the latitude values go above 90 when you cross the North Pole and below -90 when you cross the South Pole.
Next, if you wish a straight line, ensure that the two longitude values are the same.
E.g. a straight-line cross-section going through the South pole from 60S/25E to 60S/155W can be specified as -60/25/-120/25. Here the fact that one of the latitude values is below -90 indicates to Metview that the cross-section will go through the South Pole. Since the two longitude values are identical a straight line will be defined. If the longitudes were different two curves would be used (one to the pole and another one away from it).
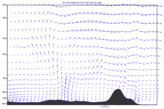
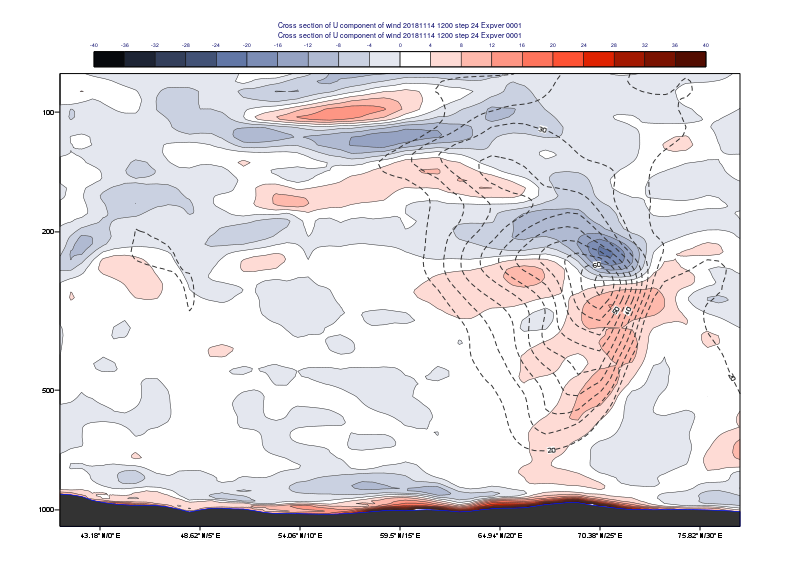
wind_parallel ({"on", "off"}, default: "on") – When this option is “on”, the wind components are projected onto the cross section plane. For 2D (horizontal) wind the result is a signed scalar data (a contour plot). When 3D wind data are available a vector plot is produced with the vertical component scaled/computed as specified in parameter
w_wind_scaling_factor_mode.wind_perpendicular ({"on", "off"}, default: "off") – When this option is “on”, the wind components are projected onto the normal vector of the cross section plane. The result is a signed scalar data (a contour plot).
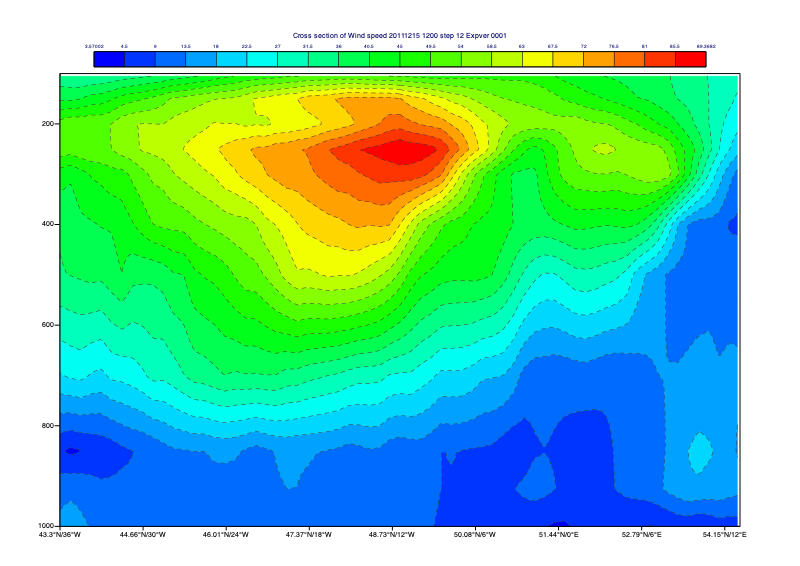
wind_perpendicularcannot be set to “on” ifwind_parallelis also “on”.wind_intensity ({"on", "off"}, default: "off") –
When this option is “on” the result depends on other settings:
When both
wind_parallelandwind_perpendicularare “off”, the result is the length of the 2D/3D wind vector at the cross section plane.When
wind_parallelis “on”, the result is the absolute value of the projected wind onto the cross section plane.When
wind_perpendicularis “on”, the result is the absolute value of the wind projected onto the normal vector of the cross section plane.
wind_unprojected ({"on", "off"}, default: "off") –
This option only has any effect when it is “on” and all
wind_parallel,wind_perpendicularandwind_intensityare “off”. In this case the 2D (horizontal) wind is sampled along the cross section plane and plotted as vector data.New in Metview version 5.12.0.
lnsp_param (number, default: 152) – Specifies the ecCodes paramId used to identify the Logarithm of Surface Pressure (LNSP) in the input data.
u_wind_param (number, default: 131) – Specifies the ecCodes paramId used to identify the U wind component in the input data.
v_wind_param (number, default: 132) – Specifies the ecCodes paramId used to identify the V wind component in the input data.
w_wind_param (number, default: 135) – Specifies the ecCodes paramId used to identify the vertical wind component in the input data. The default value is 135 i.e. pressure velocity in Pa/s (as used by ECMWF).
t_param (number, default: 130) – Specifies the ecCodes paramId used to identify the temperature in the input data. Used in the vertical wind computations when
w_wind_scaling_factor_modeis set to “compute”.horizontal_point_mode ({"interpolate", "nearest_gridpoint"}, default: "interpolate") – Specifies how the geographical points along the input transect
linewill be computed. Setting this option to “interpolate” will create a regular set of interpolated geographical points along the transectline. Setting this option to “nearest_gridpoint” will instead select the nearest points from the data.vertical_coordinates ({"default", "user"}, default: "default") – Setting this option to “user” will enable the use of arbitrary vertical coordinates. In this mode, additional GRIB fields should be supplied (one per level) where the values of the grid points represent the heights of their locations.
vertical_coordinate_param (str) – Specifies the ecCodes paramId of the general vertical coordinates if
vertical_coordinatesis “user”.vertical_coordinate_extrapolate ({"on", "off"}, default: "off") – Performs an extrapolation for target levels outside the input vertical coordinate range. Only used when
vertical_coordinatesis “user”.vertical_coordinate_extrapolate_mode ({"constant", "linear"}, default: "constant") –
Specifies the extrapolation technique. In “constant” mode the values on the nearest input levels are copied onto the target extrapolated levels. In “linear” mode a linear extrapolation is performed using the nearest two input levels. Enabled when
vertical_coordinate_extrapolateis “on”.New in Metview version 5.16.0.
vertical_coordinate_extrapolate_fixed_sign ({"on", "off"}, default: "on") –
When
vertical_coordinate_extrapolate_modeis “on” it controls whether the extrapolated values can differ in sign from the values on the nearest input levels. When it is “on” it prevents e.g. wind components to change sign due to extrapolation.New in Metview version 5.16.0.
w_wind_scaling_factor_mode ({"automatic", "user", "compute"}, default: "automatic") –
Specifies the representation of the vertical wind component (defined as
w_wind_param). The valid values are as follows:”automatic”: the values are scaled by a factor based on the geographical area, the top/bottom pressure levels and the size of the plot window. This option was kept to provide compatibility with earlier Metview versions.
”user”: the values are scaled by the factor defined via parameter
w_wind_scaling_factor.”compute”: in this mode, supposing that
w_wind_paramdefines the the pressure velocity, the vertical wind component in m/s is computed byw_from_omega(). To make it work, the input data have to be specified either on pressure levels or on model levels together with LNSP. The temperature paramId is defined byt_param. When temperature is not available, the computations will use a constant temperature value of 273.16 K. Having computed the vertical wind component, a scaling with the factor defined byw_wind_scaling_factoris still applied to the resulting values.
w_wind_scaling_factor (number, default: -100) – Specifies the vertical wind scaling factor if
w_wind_scaling_factor_modeis set to ‘user” or “compute”.level_selection_type ({"from_data", "count", "level_list"}, default: "from_data") –
Specifies the method to define the output vertical levels. The possible values are:
”from_data”: the algorithm depends on the level type.
if the input and output level types are the same the input levels will also be used as output levels
if model level data used with pressure axis first computes the absolute bottom pressure level from the data. Next for each model level computes the average pressure along the cross section line and uses it as the vertical pressure co-ordinate for that level. Finally computes extra levels at the bottom by adding an offset (10 hPa) until it reaches the bottom pressure level. This will avoid blank areas in the plot near the orography line.
when
vertical_coordinatesis “user” on each input level computes the average output coordinate along the cross section line and uses it as the output vertical co-ordinate for that level. When “vertical_coordinate_extrapolate” is “on” additional levels are added to avoid blank areas in the plot near the orography line.
”count”: calculates the output vertical levels by taking into account the bottom and top levels (
bottom_levelandtop_level) and the given number of levels (level_count). The computed levels will be evenly spaced on either a linear or a logarithmic scale depending on the value ofvertical_scaling.”level_list”: use the given list of levels in
level_list
When
vertical_coordinatesis “user” options “count” and “level_list” are only available since Metview version 5.16.0.level_list (number or list[number], default: 0.01) – Specifies the list of output vertical levels. Only available if
level_selection_typeis set to “level_list”.level_count (number, default: 100) – Specifies the number of output vertical levels if
level_selection_typeis set to “count”.vertical_scaling ({"linear", "log"}, default: "linear") – Specifies the type of the vertical_axis.
bottom_level (number, default: 1100.0) – Specifies the lower limit of the cross section, as a pressure value (hPa) or model level number (hybrid levels).
top_level (number, default: 0.01) – Specifies the upper limit of the cross section, as a pressure level (hPa) or model level number (hybrid levels).
horizontal_axis (
maxis()) – Specifies the plotting attributes of the horizontal axis.vertical_axis (
maxis()) – Specifies the plotting attributes of the vertical axis.subpage_clipping ({"on", "off"}, default: "off") – Clips plot to subpage borders.
subpage_x_position (number, default: 7.5) – Specifies the X offset of the plot from the left side of the plot frame (any subdivision of the display area). This is expressed as a percentage of the X-dimension of the plot frame.
subpage_y_position (number, default: 7) – Specifies the Y offset of the plot from the bottom side of the plot frame (any subdivision of the display area). This is expressed as a percentage of the Y-dimension of the plot frame.
subpage_x_length (number, default: 85) – Specifies the X length of the plot. This is expressed as a percentage of the X-dimension of the plot frame. Hence the sum of this X length plus the X offset cannot exceed 100 (it is advised that it does not exceed 95 since you need some margin on the right for things like axis or map grid labels).
subpage_y_length (number, default: 80) – Same as
subpage_x_lengthbut for the Y length of the plot.page_frame ({"on", "off"}, default: "off") – Toggles the plotting of a border line around the plot frame.
page_frame_colour (str, default: "charcoal") – Colour of the page frame. Available when
page_frameis “on”.page_frame_line_style ({"solid", "dot", "dash", "chain_dot", "chain_dash"}, default: "solid") – Line style of the page frame. Available when
page_frameis “on”.page_frame_thickness (number, default: 2) – Line thickness of the page frame. Available when
page_frameis “on”.page_id_line ({"on", "off"}, default: "off") – Toggles the plotting of plot identification line.
page_id_line_user_text (str) – Specifies user text to be added to the plot identification line. Only available when
page_id_lineis “on”.subpage_frame ({"on", "off"}, default: "off") – Toggles the plotting of a border line around the plot itself. In most cases you will want this to be left “on”. When “off” the sides of the plot not equipped with axis will not be plotted.
subpage_frame_colour (str, default: "black") – Colour of the subpage frame. Available when
subpage_frameis “on”.subpage_frame_line_style ({"solid", "dot", "dash", "chain_dot", "chain_dash"}, default: "solid") – Line style of the subpage frame. Available when
subpage_frameis “on”.subpage_frame_thickness (int, default: 2) – Line thickness of the subpage frame. Available when
subpage_frameis “on”.subpage_background_colour (str, default: "white") – Specifies the colour of the background of the plot (i.e. not affected by visual definitions like contour shadings or lines).
- Return type
Request