Note
Click here to download the full example code
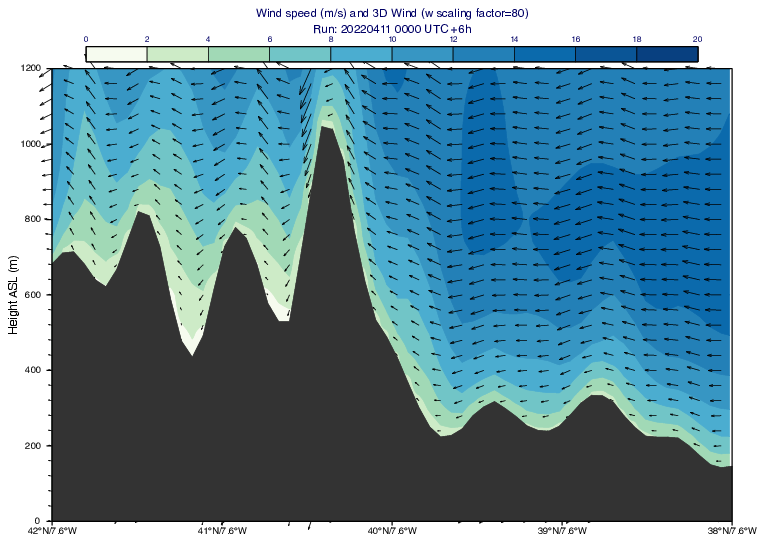
Cross Section Wind Speed and 3D Wind in Height for Model Level Data
# (C) Copyright 2017- ECMWF.
#
# This software is licensed under the terms of the Apache Licence Version 2.0
# which can be obtained at http://www.apache.org/licenses/LICENSE-2.0.
#
# In applying this licence, ECMWF does not waive the privileges and immunities
# granted to it by virtue of its status as an intergovernmental organisation
# nor does it submit to any jurisdiction.
#

import metview as mv

# Note: at least Metview version 5.16.0 is required

filename = "xs_ml_wind_orog_valley.grib"

# get data
use_mars = False

if use_mars:
    # retrieve data from MARS
    ret_core = {
        "date": 20220411,
        "time": 0,
        "area": [44, -20, 30, 0],
        "grid": [0.1, 0.1],
    }

    # forecast fields on model levels 90-137 (bottom is ML=137)
    fs_ml = mv.retrieve(
        **ret_core,
        type="fc",
        levtype="ml",
        levelist=[90, "TO", 137],
        step=6,
        param=["t", "q", "u", "v", "w"],
    )

    # log surface pressure (lnsp) is defined on ML-1!
    lnsp = mv.retrieve(
        **ret_core, type="fc", levtype="ml", levelist=1, step=6, param=["lnsp"]
    )
    # surface geopotential is available in
    # the analysis only! It is available on ML-1!
    zs = mv.retrieve(**ret_core, type="an", levtype="ml", levelist=1, param="z")
else:
    # read data from GRIB file
    if mv.exist(filename):
        fs_ml = mv.read(filename)
    else:
        fs_ml = mv.gallery.load_dataset(filename)


# extract model level data
t = mv.read(data=fs_ml, param="t")
q = mv.read(data=fs_ml, param="q")
u = mv.read(data=fs_ml, param="u")
v = mv.read(data=fs_ml, param="v")
w = mv.read(data=fs_ml, param="w")
lnsp = mv.read(data=fs_ml, param="lnsp")
zs = mv.read(data=fs_ml, param="z", levelist=1)

# compute vertical velocity in m/s
w = mv.w_from_omega(w, t, lnsp)

# compute geopotential on model levels and scale it to m
z = mv.mvl_geopotential_on_ml(t, q, lnsp, zs)
z = z / 9.81

# define cross section line
line = [42.0, -7.6, 38.0, -7.6]

# define bottom and top level (m)
top_level = 1200
bottom_level = 0

# define number of target levels
level_count = 1 + (top_level - bottom_level) / 20

# define vertical velocity scaling
w_scale_factor = 80

# compute cross sections in height (above sea level) for a fixed set
# of target levels (at least Metview version 5.16.0 is required).

# compute horizontal speed
sp = mv.speed(u, v)

# speed
xs_sp = mv.mcross_sect(
    data=mv.merge(sp, z),
    line=line,
    level_selection_type="count",
    level_count=level_count,
    vertical_coordinates="user",
    vertical_coordinate_param=129,
    vertical_coordinate_extrapolate="on",
    vertical_coordinate_extrapolate_mode="constant",
    vertical_coordinate_extrapolate_fixed_sign="on",
    top_level=top_level,
    bottom_level=bottom_level,
)
# 3D wind
xs_wind = mv.mcross_sect(
    data=mv.merge(u, v, w, z),
    line=line,
    wind_parallel="on",
    w_wind_scaling_factor_mode="user",
    w_wind_scaling_factor=w_scale_factor,
    level_selection_type="count",
    level_count=level_count,
    vertical_coordinates="user",
    vertical_coordinate_param=129,
    vertical_coordinate_extrapolate="on",
    vertical_coordinate_extrapolate_mode="constant",
    top_level=top_level,
    bottom_level=bottom_level,
)

# generate orography area curve
orog_curve = mv.xs_build_orog(xs_wind, zs / 9.81, bottom_level, "charcoal")

# define speed style
sp_style = mv.mcont(
    legend="on",
    contour="off",
    contour_level_selection_type="interval",
    contour_max_level=20,
    contour_min_level=0,
    contour_interval=2,
    contour_label="off",
    contour_shade="on",
    contour_shade_colour_method="palette",
    contour_shade_method="area_fill",
    contour_shade_palette_name="m_blue_green2_10",
)

# define wind plotting style
wind_style = mv.mwind(
    wind_thinning_factor=2, wind_arrow_colour="black", wind_arrow_unit_velocity=25
)

# define vertical axis
vertical_axis = mv.maxis(
    axis_orientation="vertical",
    axis_title_text="Height ASL (m)",
    axis_tick_label_height=0.4,
    axis_title_height=0.5,
    axis_title_position=130,
)

# define horizontal axis
horizontal_axis = mv.maxis(
    axis_orientation="horizontal",
    axis_tick_label_height=0.4,
)

# define cross section view in height above sea level (m)
xs_view = mv.mxsectview(
    line=line,
    top_level=top_level,
    bottom_level=bottom_level,
    horizontal_axis=horizontal_axis,
    vertical_axis=vertical_axis,
)

# define legend
legend = mv.mlegend(legend_text_font_size=0.35)

# get metadata for the title
meta = mv.grib_get(u[0], ["date", "time", "step"])[0]

# define title
title = mv.mtext(
    text_lines=[
        f"Wind speed (m/s) and 3D Wind (w scaling factor={w_scale_factor})",
        f"Run: {meta[0]} {meta[1]} UTC +{meta[2]}h",
    ],
    text_font_size=0.5,
)

# define the output plot file
mv.setoutput(mv.pdf_output(output_name="cross_section_wind3d_height_ml_with_valleys"))

# generate plot
mv.plot(
    xs_view,
    xs_sp,
    sp_style,
    xs_wind,
    wind_style,
    orog_curve,
    legend,
    title,
)