Note
Click here to download the full example code
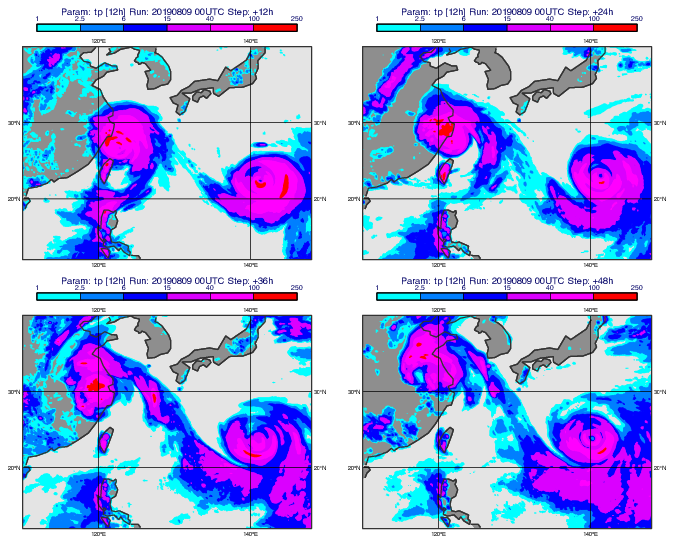
GRIB - De-accumulate Precipitation Forecast
# (C) Copyright 2017- ECMWF.
#
# This software is licensed under the terms of the Apache Licence Version 2.0
# which can be obtained at http://www.apache.org/licenses/LICENSE-2.0.
#
# In applying this licence, ECMWF does not waive the privileges and immunities
# granted to it by virtue of its status as an intergovernmental organisation
# nor does it submit to any jurisdiction.
#

import metview as mv

# getting data
use_mars = False

# getting forecast data from MARS
if use_mars:
    prec = mv.retrieve(
        type="fc",
        levtype="sfc",
        param="tp",
        date=20190809,
        time=0,
        step=[0, 12, 24, 36, 48],
        area=[12, 110, 40, 148],
        grid=[0.1, 0.1],
    )
# read data from file
else:
    filename = "lekima_prec.grib"
    if mv.exist(filename):
        prec = mv.read(filename)
    else:
        prec = mv.gallery.load_dataset(filename)

# de-accumulate precipitation by subtracting consecutive steps.
# The result is accumulated precipitation for 12 h intervals
num = len(prec)
prec = prec[1:num] - prec[0 : num - 1]

# define contour_shading. To enable the m->mm units conversion
# for contouring we need to enable "grib_scaling_of_derived_fields"
# since prec is now regarded as derived (we performed a grid operation
# on it) by Metview
prec_shade = mv.mcont(
    contour_automatic_setting="style_name",
    contour_style_name="sh_blured_f1t100lst",
    legend="on",
    grib_scaling_of_derived_fields="on",
)

# define coastlines
coastlines = mv.mcoast(
    map_coastline_colour="charcoal",
    map_coastline_thickness=2,
    map_coastline_land_shade="on",
    map_coastline_land_shade_colour="RGB(0.5569,0.5569,0.5569)",
    map_coastline_sea_shade="on",
    map_coastline_sea_shade_colour="RGB(0.8941,0.8941,0.8941)",
)

# define geographical view
view = mv.geoview(
    map_area_definition="corners", area=[12, 110, 40, 148], coastlines=coastlines
)

# create a 2x2 plot layout with the defined geoview
dw = mv.plot_superpage(pages=mv.mvl_regular_layout(view, 2, 2, 1, 1, [5, 100, 15, 100]))

# define title
title = mv.mtext(
    text_line_1="Param: <grib_info key='shortName'/> [12h] Run: <grib_info key='base-date' format='%Y%m%d %HUTC'/> Step: +<grib_info key='step'/>h",
    text_font_size=0.4,
)

# define legend
legend = mv.mlegend(legend_text_font_size=0.3)

# define output
mv.setoutput(mv.pdf_output(output_name="deaccumulate_precip_fc"))

# generate plot
mv.plot(
    dw[0],
    prec[0],
    prec_shade,
    legend,
    title,
    dw[1],
    prec[1],
    prec_shade,
    legend,
    title,
    dw[2],
    prec[2],
    prec_shade,
    legend,
    title,
    dw[3],
    prec[3],
    prec_shade,
    legend,
    title,
)