Note
Click here to download the full example code
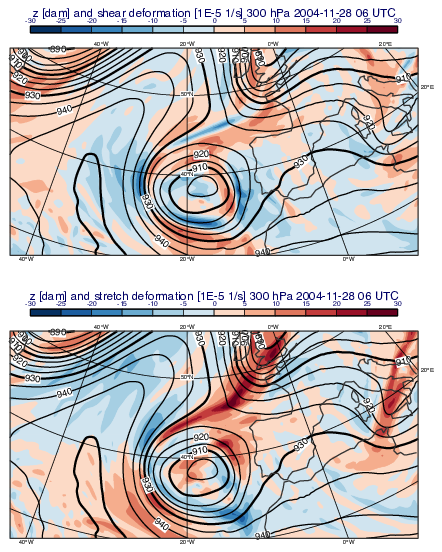
GRIB - Deformation
# (C) Copyright 2017- ECMWF.
#
# This software is licensed under the terms of the Apache Licence Version 2.0
# which can be obtained at http://www.apache.org/licenses/LICENSE-2.0.
#
# In applying this licence, ECMWF does not waive the privileges and immunities
# granted to it by virtue of its status as an intergovernmental organisation
# nor does it submit to any jurisdiction.
#

import metview as mv

# getting data
use_cds = False

filename = "deformation_era5.grib"

# getting forecast data from CDS
if use_cds:
    import cdsapi

    c = cdsapi.Client()
    c.retrieve(
        "reanalysis-era5-pressure-levels",
        {
            "product_type": "reanalysis",
            "format": "grib",
            "variable": [
                "geopotential",
                "u_component_of_wind",
                "v_component_of_wind",
            ],
            "pressure_level": ["500", "300"],
            "year": "2004",
            "month": "11",
            "day": "28",
            "time": "06:00",
            "area": [
                90,
                -100,
                20,
                40,
            ],
        },
        filename,
    )
    g = mv.read(filename)
# read data from file
else:
    if mv.exist(filename):
        g = mv.read(filename)
    else:
        g = mv.gallery.load_dataset(filename)

# get fields on 300 hPa
level = 300
z = mv.read(data=g, param="z", levelist=level)
u = mv.read(data=g, param="u", levelist=level)
v = mv.read(data=g, param="v", levelist=level)

# compute shear deformation and scale it to 1E-5 1/s units
sh_d = mv.shear_deformation(u, v)
sh_d = sh_d * 1e5

# compute stretch deformation and scale it to 1E-5 1/s units
st_d = mv.stretch_deformation(u, v)
st_d = st_d * 1e5

# define contouring
d_shade = mv.mcont(
    legend="on",
    contour="off",
    contour_level_selection_type="interval",
    contour_max_level=30,
    contour_min_level=-30,
    contour_interval=5,
    contour_label="off",
    contour_shade="on",
    contour_shade_colour_method="palette",
    contour_shade_method="area_fill",
    contour_shade_palette_name="colorbrewer_RdBu_12",
)

cont_z = mv.mcont(contour_automatic_setting="ecmwf", legend="off")

# define coastlines
coast = mv.mcoast(map_coastline_colour="charcoal", map_coastline_thickness=2)

# define the geographical view
view = mv.geoview(
    map_projection="polar_stereographic",
    map_area_definition="corners",
    area=[27.02, -41.78, 44.05, 24.34],
    map_vertical_longitude=-20,
    coastlines=coast,
)

# create a 1x2 plot layout with the defined geoview
page_0 = mv.plot_page(top=5, bottom=50, left=20, right=80, view=view)
page_1 = mv.plot_page(top=55, bottom=100, left=20, right=80, view=view)
dw = mv.plot_superpage(page=[page_0, page_1])

# define title
vdate = mv.valid_date(z)
sh_title = mv.mtext(
    text_lines="z [dam] and shear deformation [1E-5 1/s] {} hPa {}".format(
        level, vdate.strftime("%Y-%m-%d %H UTC")
    ),
    text_font_size=0.5,
)
st_title = mv.mtext(
    text_lines="z [dam] and stretch deformation [1E-5 1/s] {} hPa {}".format(
        level, vdate.strftime("%Y-%m-%d %H UTC")
    ),
    text_font_size=0.5,
)

# define legend
legend = mv.mlegend(legend_text_font_size=0.3)

# define output
mv.setoutput(mv.pdf_output(output_name="deformation"))

# generate plot
mv.plot(
    dw[0],
    sh_d,
    d_shade,
    z,
    cont_z,
    sh_title,
    legend,
    dw[1],
    st_d,
    d_shade,
    z,
    cont_z,
    st_title,
    legend,
)