Note
Click here to download the full example code
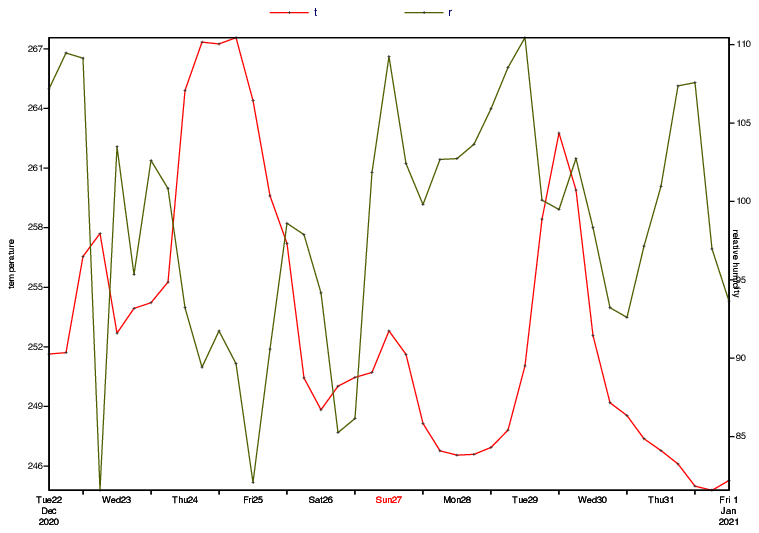
Graph Plot with Different Y Scales
# (C) Copyright 2017- ECMWF.
#
# This software is licensed under the terms of the Apache Licence Version 2.0
# which can be obtained at http://www.apache.org/licenses/LICENSE-2.0.
#
# In applying this licence, ECMWF does not waive the privileges and immunities
# granted to it by virtue of its status as an intergovernmental organisation
# nor does it submit to any jurisdiction.
#

import metview as mv

# get data
use_mars = False  # False or True
if use_mars:
    # retrieve data from MARS
    t_and_r = mv.retrieve(
        type="fc",
        date=20201222,
        time=12,
        step=[0, "to", 240, "by", 6],
        levelist=1000,
        param=["t", "r"],
        grid="O48",
    )
else:
    # read data from GRIB file
    filename = "t_and_r_ts.grib"
    if mv.exist(filename):
        t_and_r = mv.read(filename)
    else:
        t_and_r = mv.gallery.load_dataset(filename)

# filter t and r into separate fieldsets
t = mv.read(data=t_and_r, param="t")
r = mv.read(data=t_and_r, param="r")

# extract arrays of values at the North Pole
loc = [90, 0]
tvals = mv.nearest_gridpoint(t, loc)
rvals = mv.nearest_gridpoint(r, loc)
ttimes = mv.valid_date(t)
rtimes = mv.valid_date(r)

# construct input visualisers with these x/y components
t_curve = mv.input_visualiser(
    input_x_type="date", input_date_x_values=ttimes, input_y_values=tvals
)

r_curve = mv.input_visualiser(
    input_x_type="date", input_date_x_values=rtimes, input_y_values=rvals
)

# set up a Cartesian view for each curve, as they will use
# different y-axis scales

haxis = mv.maxis(
    axis_type="date",
    axis_years_label_height=0.4,
    axis_months_label_height=0.4,
    axis_days_label_height=0.4,
)

t_vertical_axis = mv.maxis(
    axis_orientation="vertical",
    axis_title_text="temperature",
    axis_title_height=0.4,
    axis_tick_label_hight=0.4,
)

t_view = mv.cartesianview(
    x_automatic="on",
    x_axis_type="date",
    y_automatic="on",
    vertical_axis=t_vertical_axis,
    horizontal_axis=haxis,
)

r_vertical_axis = mv.maxis(
    axis_orientation="vertical",
    axis_position="right",
    axis_title_text="relative humidity",
    axis_title_height=0.4,
    axis_tick_label_hight=0.4,
)

r_view = mv.cartesianview(
    x_automatic="on",
    x_axis_type="date",
    y_automatic="on",
    vertical_axis=r_vertical_axis,
    horizontal_axis=haxis,
)

# set up the pages that will use these views
p1 = mv.plot_page(view=t_view)
p2 = mv.plot_page(view=r_view)
dw = mv.plot_superpage(pages=[p1, p2])

# plotting attributes
common_graph = {
    "legend": "on",
    "graph_line_thickness": 2,
    "graph_symbol": "on",
    "graph_symbol_colour": "charcoal",
}

t_graph = mv.mgraph(common_graph, graph_line_colour="red", legend_user_text="t")
r_graph = mv.mgraph(common_graph, graph_line_colour="olive", legend_user_text="r")

# customise the legends
legend_common = {
    "legend_display_type": "disjoint",
    "legend_text_font_size": 0.5,
    "legend_box_mode": "positional",
    "legend_box_y_position": 18.2,
    "legend_box_x_length": 5,
    "legend_box_y_length": 2,
}
t_legend = mv.mlegend(legend_common, legend_box_x_position=10)
r_legend = mv.mlegend(legend_common, legend_box_x_position=15)

# Define the output plot file
mv.setoutput(mv.pdf_output(output_name="double_axis_2"))

# Plot the data curves into the different views
mv.plot(dw[0], t_curve, t_graph, t_legend, dw[1], r_curve, r_graph, r_legend)