Note
Click here to download the full example code
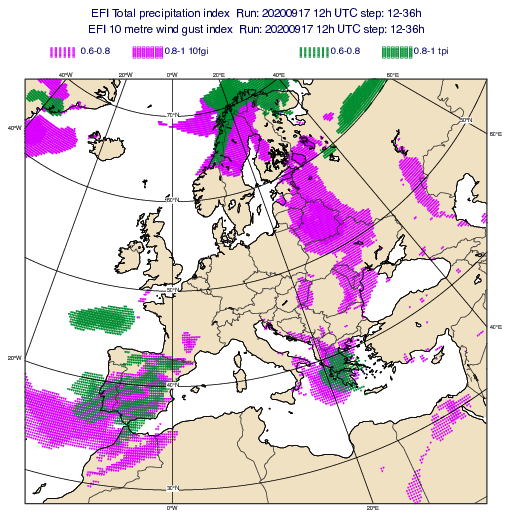
GRIB - EFI Map with Marker Shading
# (C) Copyright 2017- ECMWF.
#
# This software is licensed under the terms of the Apache Licence Version 2.0
# which can be obtained at http://www.apache.org/licenses/LICENSE-2.0.
#
# In applying this licence, ECMWF does not waive the privileges and immunities
# granted to it by virtue of its status as an intergovernmental organisation
# nor does it submit to any jurisdiction.
#

import metview as mv

# getting data
use_mars = False

# getting forecast data from MARS
if use_mars:
    # 10fgi = 49.132, 2ti = 167.132, tpi=228.132
    g = mv.retrieve(
        type="efi",
        stream="ef",
        levtype="sfc",
        param=[49.132, 167.132, 228.132],
        date=20200917,
        step="12-36",
        area=[20, -60, 80, 60],
        grid=[0.25, 0.25],
    )
# read data from file
else:
    filename = "efi.grib"
    if mv.exist(filename):
        g = mv.read(filename)
    else:
        g = mv.gallery.load_dataset(filename)

# get EFI fields
wg = mv.read(data=g, param="10fgi")
tp = mv.read(data=g, param="tpi")

# define marker shading for 10fgi
wg_shade = mv.mcont(
    legend="on",
    contour="off",
    contour_level_selection_type="level_list",
    contour_level_list=[0.6, 0.8, 1],
    contour_label="off",
    contour_shade="on",
    contour_shade_technique="marker",
    contour_shade_colour_method="list",
    contour_shade_colour_table="BLUISH_PURPLE",
    contour_shade_height_table=[0.1, 0.2],
    contour_shade_marker_table=[6, 20],
)

# define marker shading for tpi
tp_shade = mv.mcont(
    legend="on",
    contour="off",
    contour_level_selection_type="level_list",
    contour_level_list=[0.6, 0.8, 1],
    contour_label="off",
    contour_shade="on",
    contour_shade_technique="marker",
    contour_shade_colour_method="list",
    contour_shade_colour_table="KELLY_GREEN",
    contour_shade_height_table=[0.1, 0.2],
    contour_shade_marker_table=[6, 20],
)

# define coastlines
coastlines = mv.mcoast(
    map_coastline_resolution="medium",
    map_coastline_land_shade="on",
    map_coastline_land_shade_colour="RGB(0.9448,0.8819,0.765)",
    map_boundaries="on",
    map_boundaries_colour="charcoal",
)

# define view
view = mv.geoview(area_mode="name", area_name="europe", coastlines=coastlines)

# define title
title_core = "EFI <grib_info key='name'/>  Run: <grib_info key='base-date' format='%Y%m%d %H'/>h UTC step: <grib_info key='step'/>h"
title = mv.mtext(
    text_lines=title_core,
    text_font_size=0.5,
)

# define legend
legend = mv.mlegend(
    legend_display_type="disjoint",
    legend_text_font_size=0.4,
    legend_text_composition="both",
    legend_user_lines=["", "10fgi", "", "tpi"],
    legend_symbol_height_factor=2,
)

# define output
mv.setoutput(mv.pdf_output(output_name="efi_marker_shading"))

# generate plot
mv.plot(view, wg, wg_shade, tp, tp_shade, title, legend)