Note
Click here to download the full example code
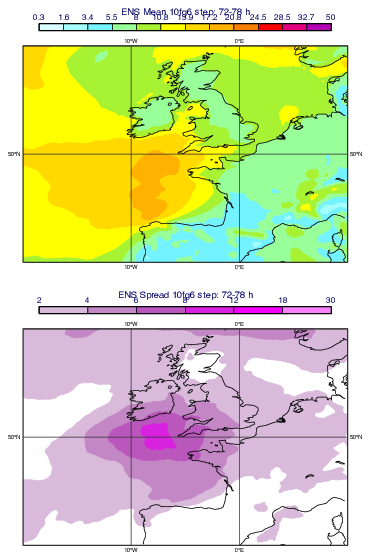
GRIB - ENS Mean and Spread
# (C) Copyright 2017- ECMWF.
#
# This software is licensed under the terms of the Apache Licence Version 2.0
# which can be obtained at http://www.apache.org/licenses/LICENSE-2.0.
#
# In applying this licence, ECMWF does not waive the privileges and immunities
# granted to it by virtue of its status as an intergovernmental organisation
# nor does it submit to any jurisdiction.
#

import metview as mv

# getting data
use_mars = False

# getting forecast data from MARS
if use_mars:
    ret_core = {
        "stream": "enfo",
        "param": "10fg6",
        "date": 20140807,
        "time": 0,
        "step": [78, 84, 90],
        "levtype": "sfc",
        "grid": [0.25, 0.25],
        "area": [60, -20, 40, 10],
    }

    # perturbed ENS members
    pf = mv.retrieve(type="pf", number=["1", "TO", "50"], **ret_core)

    # control member
    cf = mv.retrieve(type="cf", **ret_core)

    g = mv.merge(pf, cf)
# read data from file
else:
    filename = "wgust_ens.grib"
    if mv.exist(filename):
        g = mv.read(filename)
    else:
        g = mv.gallery.load_dataset(filename)

# extract a given timestep
wg = mv.read(data=g, step=78)

# compute ENS mean
f_mean = mv.mean(wg)

# compute ENS spread (=standard deviation)
f_spread = mv.stdev(wg)

# define contour shading
cont_mean = mv.mcont(
    contour_automatic_setting="style_name",
    contour_style_name="sh_all_f03t70_beauf",
    legend="on",
)

cont_spread = mv.mcont(
    contour_automatic_setting="style_name",
    contour_style_name="sh_blu_f02t30",
    legend="on",
)

# define coastline
coast = mv.mcoast(map_grid_colour="charcoal", map_grid_longitude_increment=10)

# define map view
view = mv.geoview(
    map_area_definition="corners", area=[40, -20, 60, 10], coastlines=coast
)

# create a 1x2 plot layout with the defined geoview
page_0 = mv.plot_page(top=5, bottom=50, left=20, right=80, view=view)
page_1 = mv.plot_page(top=55, bottom=100, left=20, right=80, view=view)
dw = mv.plot_superpage(page=[page_0, page_1])

# define tite
title_mean = mv.mtext(
    text_lines="ENS Mean <grib_info key='shortName'/> step: <grib_info key='stepRange'/> h",
    text_font_size=0.4,
)

title_spread = mv.mtext(
    text_lines="ENS Spread <grib_info key='shortName'/> step: <grib_info key='stepRange'/> h",
    text_font_size=0.4,
)

# define legend
legend = mv.mlegend(legend_text_font_size=0.35)

# define the output plot file
mv.setoutput(mv.pdf_output(output_name="ens_mean_and_spread"))

# build plot definition
p_def = [
    dw[0],
    f_mean,
    cont_mean,
    title_mean,
    legend,
    dw[1],
    f_spread,
    cont_spread,
    title_spread,
    legend
]

# generate plot
mv.plot(p_def)