Note
Click here to download the full example code
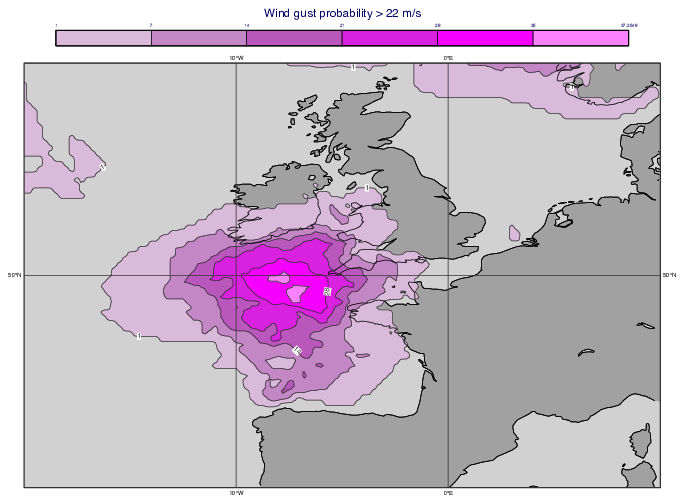
GRIB - ENS Windgust Probability
# (C) Copyright 2017- ECMWF.
#
# This software is licensed under the terms of the Apache Licence Version 2.0
# which can be obtained at http://www.apache.org/licenses/LICENSE-2.0.
#
# In applying this licence, ECMWF does not waive the privileges and immunities
# granted to it by virtue of its status as an intergovernmental organisation
# nor does it submit to any jurisdiction.
#

import metview as mv

# read ENS forecast
filename = "wgust_ens.grib"
if mv.exist(filename):
    g = mv.read(filename)
else:
    g = mv.gallery.load_dataset(filename)

# filter out a timestep
wg = mv.read(data=g, step=78)

# create mask (with 0s and 1s) for windgust > 22 m/s
wg_mask = wg > 22

# compute probability
prob = mv.mean(wg_mask) * 100

# define contour shading
cont = mv.mcont(
    legend="on",
    contour_line_colour="charcoal",
    contour_highlight="off",
    contour_min_level=1,
    contour_level_count=6,
    contour_shade="on",
    contour_shade_colour_method="palette",
    contour_shade_method="area_fill",
    contour_shade_palette_name="eccharts_purple_magenta_6",
)

# define coastline
coast = mv.mcoast(
    map_coastline_land_shade="on",
    map_coastline_land_shade_colour="RGB(0.6328,0.6299,0.6299)",
    map_coastline_sea_shade="on",
    map_coastline_sea_shade_colour="RGB(0.8196,0.8196,0.8196)",
    map_grid_colour="charcoal",
    map_grid_longitude_increment=10,
)

# define map view
view = mv.geoview(
    map_area_definition="corners", area=[40, -20, 60, 10], coastlines=coast
)

# define title
title = mv.mtext(text_lines=["Wind gust probability > 22 m/s"], text_font_size=0.5)

# define the output plot file
mv.setoutput(mv.pdf_output(output_name="ens_prob"))

# generate plot
mv.plot(view, prob, cont, title)