Note
Click here to download the full example code
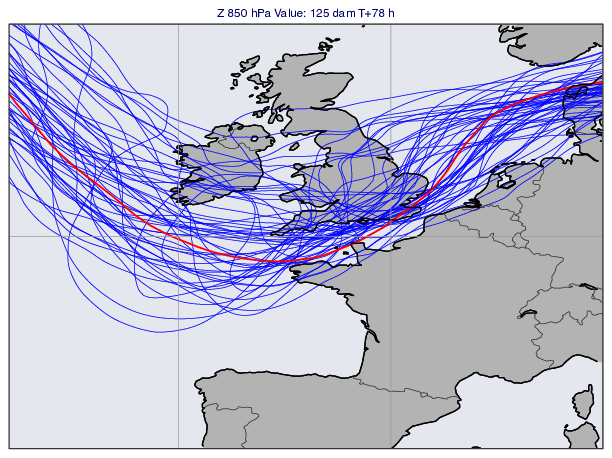
GRIB - ENS Spaghetti Map
# (C) Copyright 2017- ECMWF.
#
# This software is licensed under the terms of the Apache Licence Version 2.0
# which can be obtained at http://www.apache.org/licenses/LICENSE-2.0.
#
# In applying this licence, ECMWF does not waive the privileges and immunities
# granted to it by virtue of its status as an intergovernmental organisation
# nor does it submit to any jurisdiction.
#

import metview as mv

# read the ENS forecast
filename = "z850_ens.grib"
if mv.exist(filename):
    z = mv.read(filename)
else:
    z = mv.gallery.load_dataset(filename)

# define contour line for perturbed members (pf)
cont_pf = mv.mcont(
    contour_label="off",
    contour_level_selection_type="level_list",
    contour_level_list=125,
    contour_line_colour="blue",
    contour_highlight="off",
    grib_scaling_of_derived_fields="on",
)

# define contour line for control forecast (cf)
cont_cf = mv.mcont(cont_pf, contour_line_colour="red", contour_line_thickness=3)

# define coastlines
coast = mv.mcoast(
    map_coastline_land_shade="on",
    map_coastline_land_shade_colour="grey",
    map_coastline_sea_shade="on",
    map_coastline_sea_shade_colour="RGB(0.8944,0.9086,0.933)",
    map_coastline_thickness=2,
    map_boundaries="on",
    map_boundaries_colour="charcoal",
    map_label="off",
    map_grid_colour="RGB(0.6, 0.6, 0.6)",
    map_grid_longitude_increment=10,
)

# define map view
view = mv.geoview(
    map_area_definition="corners", area=[40, -18, 60, 10], coastlines=coast
)

# define the output plot file
mv.setoutput(mv.pdf_output(output_name="ens_spag"))

# perturbed forecasts
pf = []
for i in range(1, 51):
    f = mv.read(data=z, type="pf", number=i)
    pf.append(f)

# control forecast
cf = mv.read(data=z, type="cf")

# define title (this solution prevents the title
# from appearing 51 times in the plot!!)
title = mv.mtext(
    text_line_1="Z 850 hPa Value: 125 dam T+<grib_info key='step' where='number=50' /> h",
    text_font_size=0.5,
)

mv.plot(view, pf, cont_pf, cf, cont_cf, title)