Note
Click here to download the full example code
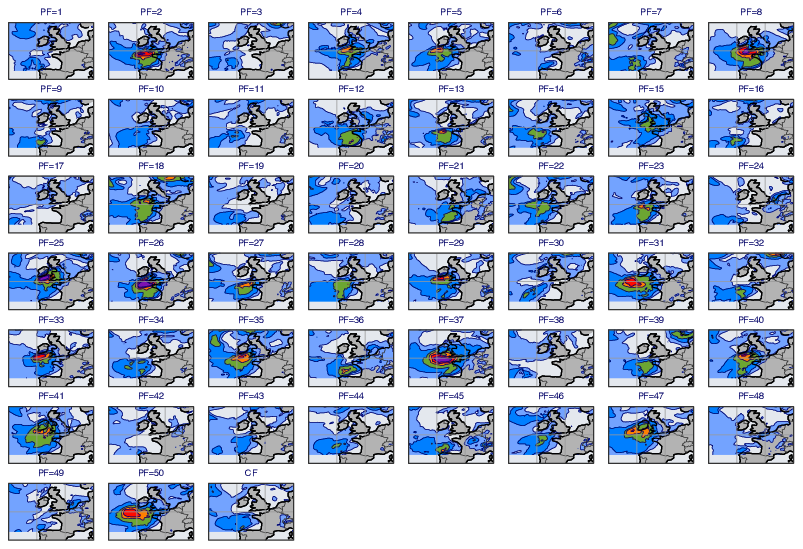
GRIB - ENS Stamp Map
# (C) Copyright 2017- ECMWF.
#
# This software is licensed under the terms of the Apache Licence Version 2.0
# which can be obtained at http://www.apache.org/licenses/LICENSE-2.0.
#
# In applying this licence, ECMWF does not waive the privileges and immunities
# granted to it by virtue of its status as an intergovernmental organisation
# nor does it submit to any jurisdiction.
#

import metview as mv

# read ENS forecast
filename = "wgust_ens.grib"
if mv.exist(filename):
    g = mv.read(filename)
else:
    g = mv.gallery.load_dataset(filename)

# filter out a timestep
wg = mv.read(data=g, step=78)

# define contour shading
wgust_shade = mv.mcont(
    legend="off",
    contour_line_colour="navy",
    contour_highlight="off",
    contour_level_selection_type="level_list",
    contour_level_list=[10, 15, 20, 25, 30, 35, 50],
    contour_label="off",
    contour_shade="on",
    contour_shade_colour_method="list",
    contour_shade_method="area_fill",
    contour_shade_colour_list=[
        "sky",
        "greenish_blue",
        "avocado",
        "orange",
        "orangish_red",
        "violet",
    ],
)

# define coastline
coast = mv.mcoast(
    map_coastline_land_shade="on",
    map_coastline_land_shade_colour="grey",
    map_coastline_sea_shade="on",
    map_coastline_sea_shade_colour="RGB(0.8944,0.9086,0.933)",
    map_coastline_thickness=2,
    map_boundaries="on",
    map_boundaries_colour="charcoal",
    map_label="off",
    map_grid_colour="RGB(0.6, 0.6, 0.6)",
    map_grid_longitude_increment=10,
)

# define map view
view = mv.geoview(
    map_area_definition="corners", area=[40, -20, 60, 10], coastlines=coast
)

# define layout
dw = mv.plot_superpage(pages=mv.mvl_regular_layout(view, 8, 7, 1, 1, [5, 100, 0, 100]))

# define the output plot file
mv.setoutput(mv.pdf_output(output_name="ens_stamp"))

# generate plot
pl_lst = []

# perturbed forecasts
for i in range(1, 51):
    f = mv.read(data=wg, type="pf", number=i)
    title = mv.mtext(text_lines=["PF=" + str(i)], text_font_size=0.4)
    pl_lst.append([dw[i - 1], f, wgust_shade, title])

# control forecast
f = mv.read(data=wg, type="cf")
title = mv.mtext(text_lines=["CF"], text_font_size=0.4)
pl_lst.append([dw[50], f, wgust_shade, title])

mv.plot(pl_lst)