Note
Click here to download the full example code
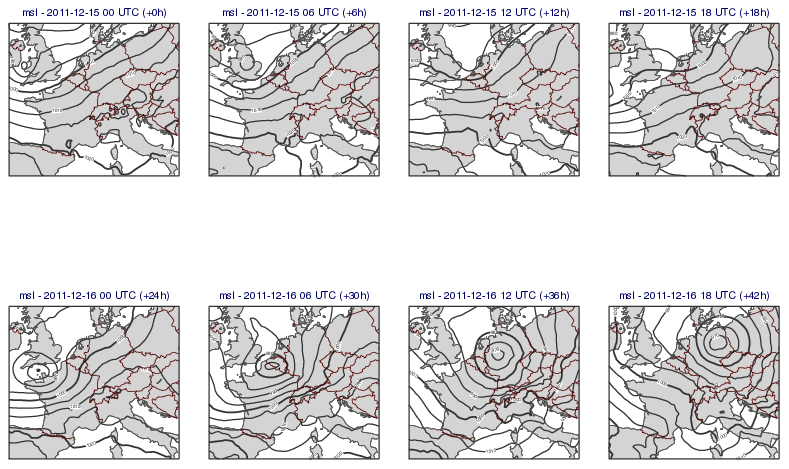
GRIB - Forecast Steps
# (C) Copyright 2017- ECMWF.
#
# This software is licensed under the terms of the Apache Licence Version 2.0
# which can be obtained at http://www.apache.org/licenses/LICENSE-2.0.
#
# In applying this licence, ECMWF does not waive the privileges and immunities
# granted to it by virtue of its status as an intergovernmental organisation
# nor does it submit to any jurisdiction.
#

import metview as mv

# getting data
use_mars = False

# getting forecast data from MARS
if use_mars:
    g = mv.retrieve(
        type="fc",
        levtype="sfc",
        param=["msl", "10fg6"],
        date=20111215,
        time=00,
        step=[0, "to", 48, "by", 6],
        area=[80, -60, 20, 60],
        grid=[0.5, 0.5],
    )
# reading data from file or getting from data server
else:
    filename = "fc_msl_wg_joachim.grib"
    if mv.exist(filename):
        g = mv.read(filename)
    else:
        g = mv.gallery.load_dataset(filename)

# read msl
msl = g.select(shortName="msl")

# define contouring for msl
cont_msl = mv.mcont(
    contour_line_thickness=2,
    contour_line_colour="charcoal",
    contour_highlight="on",
    contour_highlight_colour="charcoal",
    contour_highlight_thickness=3,
    contour_level_selection_type="interval",
    contour_interval=5,
    contour_label_height=0.2,
)

# define coastlines
coast = mv.mcoast(
    map_coastline_colour="RGB(0.3137,0.3137,0.3137)",
    map_coastline_resolution="medium",
    map_coastline_land_shade="on",
    map_coastline_land_shade_colour="RGB(0.8314,0.8314,0.8314)",
    map_boundaries="on",
    map_boundaries_colour="chestnut",
    map_grid="off",
    map_label="off",
)

# define geo view
view = mv.geoview(area_mode="name", area_name="central_europe", coastlines=coast)

# create a 2x4 plot layout with the defined geoview
pages = mv.mvl_regular_layout(view, 4, 2, 1, 1, [0, 100, 0, 100])
dw = mv.plot_superpage(pages=pages)

# define title - will automatically extract specified GRIB metadata
title = mv.mtext(
    text_line_1="<grib_info key='shortName'/> - <grib_info key='valid-date' format='%Y-%m-%d %H'/> UTC (+<grib_info key='step'/>h)",
    text_font_size=0.45,
)

# define the output plot file
mv.setoutput(mv.pdf_output(output_name="fc_steps"))

# generate plot object
d = [[dw[i], msl[i], cont_msl, title] for i in range(len(dw))]

# generate plot
mv.plot(d)