Note
Click here to download the full example code
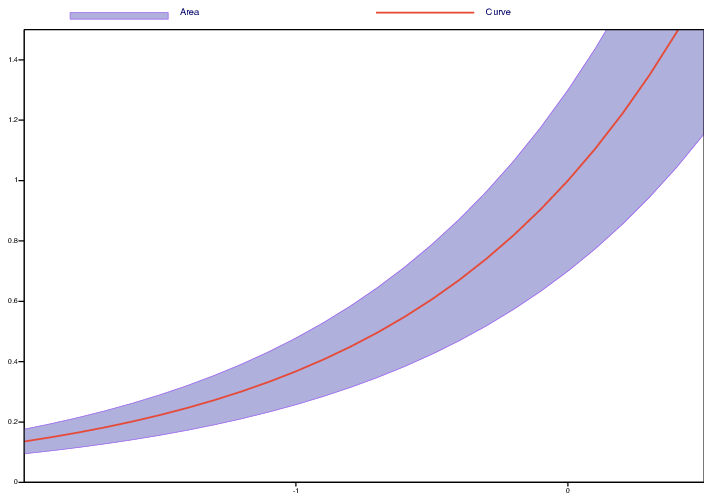
Fill the area between two curves
# (C) Copyright 2017- ECMWF.
#
# This software is licensed under the terms of the Apache Licence Version 2.0
# which can be obtained at http://www.apache.org/licenses/LICENSE-2.0.
#
# In applying this licence, ECMWF does not waive the privileges and immunities
# granted to it by virtue of its status as an intergovernmental organisation
# nor does it submit to any jurisdiction.
#

import metview as mv
import numpy as np

# define the curves to be plotted
x = np.arange(-2, 0.6, 0.1)
y = np.exp(x)
y1 = y * 0.7
y2 = y * 1.3

# define area bounded by two curves (y1 and y2)
vis_area = mv.input_visualiser(
    input_plot_type="xy_area",
    input_x_values=x,
    input_y_values=y1,
    input_x2_values=x,
    input_y2_values=y2,
)

# define area style
gr_area = mv.mgraph(
    legend="on",
    graph_type="area",
    graph_line_colour="lavender",
    graph_shade_colour="RGB(0.6888,0.6888,0.8641)",
)

# define curve
vis_curve = mv.input_visualiser(input_x_values=x, input_y_values=y)

# define curve style
gr_curve = mv.mgraph(
    legend="on", graph_type="curve", graph_line_colour="coral", graph_line_thickness=3
)

# define view
view = mv.cartesianview(x_automatic="on", y_min=0, y_max=1.5, subpage_clipping="on")

# define legend
legend = mv.mlegend(
    legend_display_type="disjoint",
    legend_text_font_size=0.4,
    legend_text_composition="user_text_only",
    legend_user_lines=["Area", "Curve"],
)

# define the output plot file
mv.setoutput(mv.pdf_output(output_name="fill_between_curves"))

# generate plot
mv.plot(view, vis_area, gr_area, vis_curve, gr_curve, legend)