Note
Click here to download the full example code
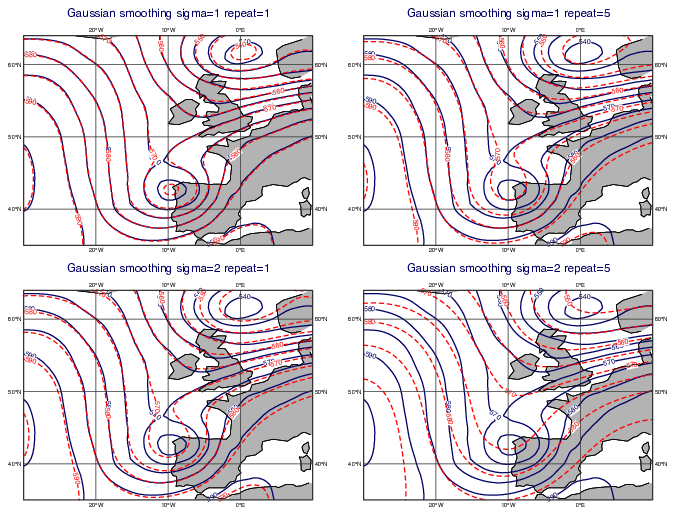
GRIB - Gaussian Smoothing
# (C) Copyright 2017- ECMWF.
#
# This software is licensed under the terms of the Apache Licence Version 2.0
# which can be obtained at http://www.apache.org/licenses/LICENSE-2.0.
#
# In applying this licence, ECMWF does not waive the privileges and immunities
# granted to it by virtue of its status as an intergovernmental organisation
# nor does it submit to any jurisdiction.
#

import metview as mv

# getting data
use_mars = False

filename = "z500_1x1.grib"

# getting forecast data from MARS
if use_mars:
    f = mv.retrieve(
        type="an",
        levtype="pl",
        param="z",
        levelist=500,
        date=20220619,
        time=0,
        area=[70, -80, 20, 40],
        grid=[1, 1],
    )
    mv.write(filename, f)
# read data from file or download server
else:
    if mv.exist(filename):
        f = mv.read(filename)
    else:
        f = mv.gallery.load_dataset(filename)

# perform Gaussian smoothing with 4 options
sigmas = [1, 1, 2, 2]
repeats = [1, 5, 1, 5]
r = [
    f.smooth_gaussian(sigma=sigma, repeat=repeat)
    for sigma, repeat in zip(sigmas, repeats)
]

# define contouring
cont_red = mv.mcont(
    contour_line_thickness=2,
    contour_line_style="dash",
    contour_line_colour="red",
    contour_highlight="off",
    contour_level_selection_type="interval",
    contour_interval=5,
    grib_scaling_of_derived_fields="on",
)

cont_blue = mv.mcont(
    contour_line_thickness=2,
    contour_line_colour="navy",
    contour_highlight="off",
    contour_level_selection_type="interval",
    contour_interval=5,
    grib_scaling_of_derived_fields="on",
)

# define coastline
coast = mv.mcoast(
    map_coastline_land_shade="on",
    map_coastline_land_shade_colour="grey",
    map_grid_colour="charcoal",
    map_grid_longitude_increment=10,
)

# define map view
view = mv.geoview(
    map_area_definition="corners", area=[64, -30, 35, 10], coastlines=coast
)

# create a 2x2 plot layout with the defined geoview
dw = mv.plot_superpage(pages=mv.mvl_regular_layout(view, 2, 2, 1, 1, [5, 95, 15, 100]))

# define the output plot file
mv.setoutput(mv.pdf_output(output_name="gaussian_smoothing"))

# build plot definition
p_def = []
for i in range(4):
    title = mv.mtext(
        text_lines=[f"Gaussian smoothing sigma={sigmas[i]} repeat={repeats[i]}"],
        text_font_size=0.5,
    )
    p_def.extend([dw[i], f, cont_blue, r[i], cont_red, title])

# generate plot
mv.plot(p_def)