Note
Click here to download the full example code
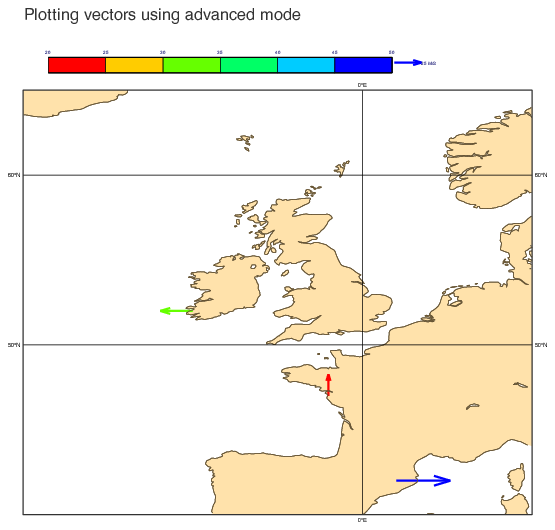
Wind Vectors from List Data
# (C) Copyright 2017- ECMWF.
#
# This software is licensed under the terms of the Apache Licence Version 2.0
# which can be obtained at http://www.apache.org/licenses/LICENSE-2.0.
#
# In applying this licence, ECMWF does not waive the privileges and immunities
# granted to it by virtue of its status as an intergovernmental organisation
# nor does it submit to any jurisdiction.
#

# -------------------------------------------------------------------------------
# Demonstrates how to plot a set of vectors as coloured arrows using
# advance mode (colour depends on arrow length).
# -------------------------------------------------------------------------------

import metview as mv

# set up the coastlines
my_coast = mv.mcoast(
    map_coastline_sea_shade="ON",
    map_coastline_land_shade_colour="CREAM",
    map_grid="ON",
    map_coastline_land_shade="ON",
    map_coastline_sea_shade_colour="WHITE",
    map_label="ON",
    map_coastline_colour="TAN",
)

# set up the geographical view
my_view = mv.geoview(
    map_area_definition="CORNERS",
    map_projection="CYLINDRICAL",
    area=[40.00, -20.00, 65.00, 10.00],
    coastlines=my_coast,
)

# define the wind vectors using "geo_vectors" plot type
my_input = mv.input_visualiser(
    input_plot_type="geo_vectors",
    input_latitude_values=[42, 47, 52],
    input_longitude_values=[2, -2, -10],
    input_x_component_values=[50, 0, -30],
    input_y_component_values=[0, 20, 0],
)

# set up the vectors plot properties
my_wind = mv.mwind(
    legend="on",
    wind_advanced_method="on",
    wind_advanced_colour_selection_type="interval",
    wind_advanced_colour_level_interval=5.0,
    wind_arrow_thickness=2,
    wind_arrow_legend_text="M/S",
)

# set up the title
my_title = mv.mtext(
    text_font_size=0.7,
    text_lines=["Plotting vectors using advanced mode", ""],
    text_justification="LEFT",
    text_colour="CHARCOAL",
)

# define the output plot file
mv.setoutput(mv.pdf_output(output_name="geowind"))

# plot the data onto the map
mv.plot(my_view, my_input, my_wind, my_title)