Note
Click here to download the full example code
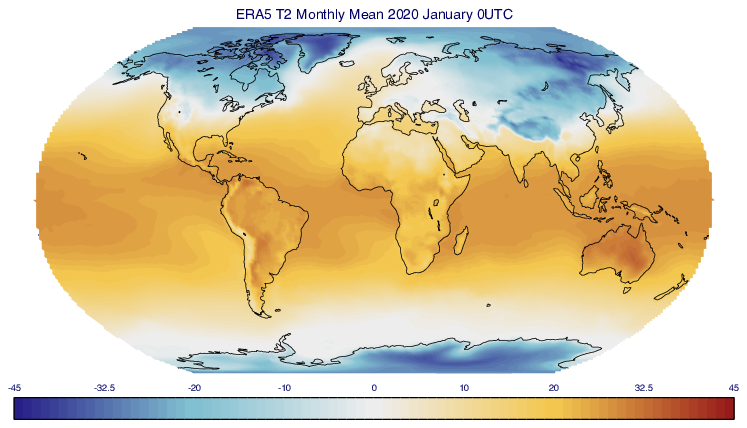
GRIB - Contouring with Gradient Shading
# (C) Copyright 2017- ECMWF.
#
# This software is licensed under the terms of the Apache Licence Version 2.0
# which can be obtained at http://www.apache.org/licenses/LICENSE-2.0.
#
# In applying this licence, ECMWF does not waive the privileges and immunities
# granted to it by virtue of its status as an intergovernmental organisation
# nor does it submit to any jurisdiction.
#

import metview as mv

# get data
use_mars = False
if use_mars:
    # retrieve data from MARS
    t = mv.retrieve(
        class_="era5",
        stream="moda",
        levtype="sfc",
        param="2t",
        date=20200101,
        time=0,
        grid=[1, 1],
    )
else:
    # read data from GRIB file
    filename = "era5_t2_jan.grib"
    if mv.exist(filename):
        t = mv.read(filename)
    else:
        t = mv.gallery.load_dataset(filename)

# define coastlines
coast = mv.mcoast(map_grid="off", map_label="off")

# define view
view = mv.geoview(
    map_projection="robinson",
    subpage_y_position=14,
    subpage_y_length=86,
    coastlines=coast,
    page_frame="off",
    subpage_frame="off",
)

# define contouring
cont = mv.mcont(
    legend="on",
    contour="off",
    contour_level_selection_type="level_list",
    contour_level_list=[-45, -20, 0, 20, 45],
    contour_label="off",
    contour_shade="on",
    contour_shade_colour_method="gradients",
    contour_shade_method="area_fill",
    contour_gradients_colour_list=[
        "RGB(0.1532,0.1187,0.5323)",
        "RGB(0.5067,0.7512,0.8188)",
        "RGB(0.9312,0.9313,0.9275)",
        "RGB(0.9523,0.7811,0.3104)",
        "RGB(0.594,0.104,0.104)",
    ],
    contour_gradients_step_list=20,
)

# define legend
legend = mv.mlegend(
    legend_box_mode="positional",
    legend_text_font_size=0.4,
    legend_box_y_position=1,
    legend_box_y_length=1.5,
    legend_entry_border="off",
    legend_label_frequency=10,
)

# define title
title = mv.mtext(
    text_line_1="ERA5 T2 Monthly Mean 2020 January 0UTC", text_font_size=0.6
)

# define the output plot file
mv.setoutput(mv.pdf_output(output_name="gradient_shading"))

# generate plot
mv.plot(view, t, cont, title, legend)