Note
Click here to download the full example code
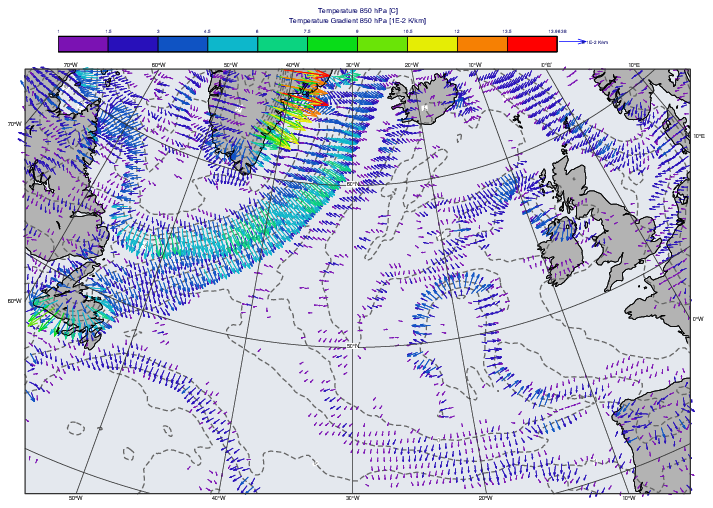
GRIB - Temperature Gradient Vectors
# (C) Copyright 2017- ECMWF.
#
# This software is licensed under the terms of the Apache Licence Version 2.0
# which can be obtained at http://www.apache.org/licenses/LICENSE-2.0.
#
# In applying this licence, ECMWF does not waive the privileges and immunities
# granted to it by virtue of its status as an intergovernmental organisation
# nor does it submit to any jurisdiction.
#

import metview as mv

# read t field (the only field in the file)
filename = "t850.grb"
if mv.exist(filename):
    t = mv.read(filename)
else:
    t = mv.gallery.load_dataset(filename)

# compute gradient
grad = mv.gradient(t)

# scale gradient
grad = grad * 1e5

# define the vector structure for plotting
v = mv.grib_vectors(u_component=grad[0], v_component=grad[1])

# define wind plotting for gradient
wp = mv.mwind(
    wind_thinning_factor=1,
    legend="on",
    wind_advanced_method="on",
    wind_advanced_colour_min_value=1,
    wind_advanced_colour_max_level_colour="red",
    wind_advanced_colour_min_level_colour="violet",
    wind_advanced_colour_direction="clockwise",
    wind_arrow_unit_velocity=8,
    wind_arrow_thickness=1,
    wind_arrow_legend_text="1E-2 K/km",
)

# define contouring for temeprature
t_cont = mv.mcont(
    contour_line_colour="RGB(0.4,0.4,0.4)",
    contour_line_style="dash",
    contour_line_thickness=2,
    contour_highlight="off",
    contour_level_selection_type="interval",
    contour_interval=2,
    contour_label_height=0.25,
    grib_scaling_of_derived_fields="on",
)

# define caastline
coast = mv.mcoast(
    map_coastline_land_shade="on",
    map_coastline_land_shade_colour="grey",
    map_coastline_sea_shade="on",
    map_coastline_sea_shade_colour="RGB(0.8944,0.9086,0.933)",
    map_grid_colour="charcoal",
    map_grid_longitude_increment=10,
)

# define map view
view = mv.geoview(
    map_projection="polar_stereographic",
    map_area_definition="corners",
    area=[37.71, -53.33, 58.46, 15.21],
    map_vertical_longitude=-30,
    coastlines=coast,
)


# define title
title = mv.mtext(
    text_lines=["Temperature 850 hPa [C]", "Temperature Gradient 850 hPa [1E-2 K/km]"]
)

# define the output plot file
mv.setoutput(mv.pdf_output(output_name="gradient_vector"))

# generate plot
mv.plot(view, t, t_cont, v, wp, title)