Note
Click here to download the full example code
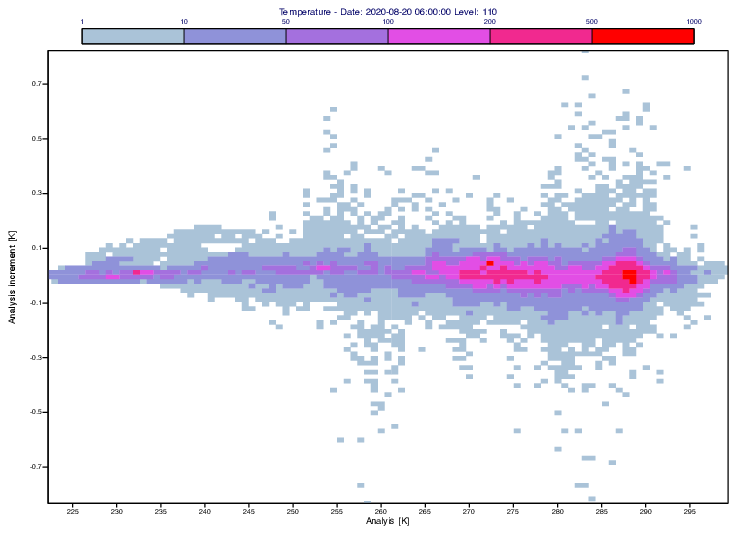
GRIB Scatterplot
# (C) Copyright 2017- ECMWF.
#
# This software is licensed under the terms of the Apache Licence Version 2.0
# which can be obtained at http://www.apache.org/licenses/LICENSE-2.0.
#
# In applying this licence, ECMWF does not waive the privileges and immunities
# granted to it by virtue of its status as an intergovernmental organisation
# nor does it submit to any jurisdiction.
#

import metview as mv

# get data
use_mars = False
if use_mars:
    # retrieve data from MARS

    # analysis
    an = mv.retrieve(
        type="an", levtype="ml", levelist=110, param="t", time=6, grid=[1, 1]
    )

    # analysis increment
    an_incr = mv.retrieve(
        type="4i",
        levtype="ml",
        levelist=110,
        param=200130,
        time=9,
        iteration=3,
        grid=[1, 1],
    )
else:
    # read data from GRIB file
    filename = "an_incr.grib"
    if mv.exist(filename):
        f = mv.read(filename)
    else:
        f = mv.gallery.load_dataset(filename)

    an = f[0]
    an_incr = f[1]

# extract field values into numpy arrays
v1 = mv.values(an)
v2 = mv.values(an_incr)

# define 2D-binning for scatterplot
b = mv.binning(binning_x_count=100, binning_y_count=100)

# define scatterplot
vis = mv.input_visualiser(
    input_plot_type="xy_binning", input_x_values=v1, input_y_values=v2, input_binning=b
)

# define contour shading
cont = mv.mcont(
    legend="on",
    contour="off",
    contour_level_selection_type="level_list",
    contour_level_list=[1, 10, 50, 100, 200, 500, 1000],
    contour_label="off",
    contour_shade="on",
    contour_shade_technique="grid_shading",
    contour_shade_max_level_colour="red",
    contour_shade_min_level_colour="RGB(0.6672,0.7658,0.8465)",
)

# define axes
horizontal_axis = mv.maxis(
    axis_position="left", axis_title_text="Analyis [K]", axis_tick_interval=5
)

vertical_axis = mv.maxis(
    axis_orientation="vertical", axis_title_text="Analysis increment [K]"
)

# define view
view = mv.cartesianview(
    x_automatic="on",
    y_automatic="on",
    horizontal_axis=horizontal_axis,
    vertical_axis=vertical_axis,
)

# define title
txt = "Temperature - Date: {} Level: 110".format(mv.base_date(an))
title = mv.mtext(text_line_1=txt, text_font_size=0.4)

# define legend
legend = mv.mlegend(legend_text_font_size=0.3)

# define the output plot file
mv.setoutput(mv.pdf_output(output_name="grib_scatterplot"))

# generate plot
mv.plot(view, vis, cont, title, legend)