Note
Click here to download the full example code
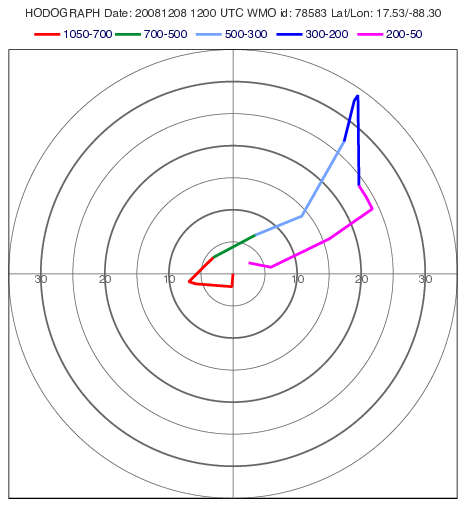
BUFR - Hodograph
# (C) Copyright 2017- ECMWF.
#
# This software is licensed under the terms of the Apache Licence Version 2.0
# which can be obtained at http://www.apache.org/licenses/LICENSE-2.0.
#
# In applying this licence, ECMWF does not waive the privileges and immunities
# granted to it by virtue of its status as an intergovernmental organisation
# nor does it submit to any jurisdiction.
#

import metview as mv
import numpy as np


def build_view(hodo_incr=5, hodo_max_val=35):
    """
    Utility function to build a view for the hodograph
    """

    # ----------------------------
    # define the hodograph view
    # ----------------------------

    # the maximum radial size of the coordinate system
    hodo_max_val = np.ceil(hodo_max_val / hodo_incr) * hodo_incr

    # define horizontal and vertical  axes
    h_axis = mv.maxis(axis_position="left", axis_tick="off", axis_tick_label="off")
    v_axis = mv.maxis(axis_position="bottom", axis_tick="off", axis_tick_label="off")

    # the view
    view = mv.cartesianview(
        x_automatic="off",
        x_min=-hodo_max_val,
        x_max=hodo_max_val,
        y_automatic="off",
        y_min=-hodo_max_val,
        y_max=hodo_max_val,
        horizontal_axis=h_axis,
        vertical_axis=v_axis,
        subpage_frame="on",
        subpage_frame_thickness=1,
        subpage_x_position=5,
        subpage_y_position=5,
        subpage_x_length=90,
        subpage_y_length=90,
    )

    # define the hodograph plot page.
    # NOTE: In order to correctly render the hodograph (we want
    # concentric circles instead of ellipses) we have to ensure
    # that the physical width and height of the plot are the same.
    # Please note that while the page size is defined in % the
    # superpage size is defined in cm! See also subpage size in the view.

    # physical size of the whole plot (A4 landscape)
    sp_width = 29.7
    sp_height = 21

    hodo_width = 18.5  # cm
    hodo_height = 18.5  # cm
    page_width = 100 * hodo_width / sp_width
    page_height = 100 * hodo_height / sp_height
    page_top = 10
    page_left = (100 - page_width) / 2

    hodo_page = mv.plot_page(
        top=page_top,
        bottom=page_top + page_height,
        left=page_left,
        right=page_left + page_width,
        view=view,
    )

    # define the superpage (A4 landscape)

    dw = mv.plot_superpage(pages=[hodo_page])
    return dw[0]


def build_hodo_bg(
    hodo_incr=5,
    hodo_max_val=35,
    hodo_highlight=[10, 20, 30],
    hodo_label=[10, 20, 30],
    hodo_label_size=0.5,
    hodo_colour="black",
):
    """
    Utility function to generate plot objects making up
    the hodograph background
    """

    # the maximum radial size of the coordinate system
    hodo_max_val = np.ceil(hodo_max_val / hodo_incr) * hodo_incr

    gr_lst = []

    # build the concentric circles
    sp = hodo_incr
    angle_incr = 2 * np.pi / 180
    while sp <= hodo_max_val:
        xp = [np.cos(i * angle_incr) * sp for i in range(1, 182)]
        yp = [np.sin(i * angle_incr) * sp for i in range(1, 182)]
        gr = mv.xy_curve(xp, yp, hodo_colour, "solid", 3 if sp in hodo_highlight else 1)
        gr_lst.append(gr)
        sp += hodo_incr

    # build horizontal and vertical lines going
    # through the centre
    gr_lst.append(
        mv.xy_curve([-hodo_max_val, hodo_max_val], [0, 0], hodo_colour, "solid", 1)
    )
    gr_lst.append(
        mv.xy_curve([0, 0], [-hodo_max_val, hodo_max_val], hodo_colour, "solid", 1)
    )

    # add labels to the horizontal line
    vis = mv.input_visualiser(
        input_plot_type="xy_point",
        input_x_values=[-v for v in hodo_label] + hodo_label,
        input_y_values=[0] * 2 * len(hodo_label),
        input_values=hodo_label + hodo_label,
    )

    sym = mv.msymb(
        symbol_colour=hodo_colour,
        symbol_text_font_size=hodo_label_size,
        symbol_text_font_style="normal",
        symbol_text_position="bottom",
    )

    gr_lst.extend([vis, sym])

    return gr_lst


def build_hodo_wind(prof, pres_bins, pres_colours):
    """
    Utility function to generate plot objects for the hodograph
    wind data (per bin)
    """

    # get individual profiles as vectors. Values are sorted by descending
    # pressure, no missing values includes.
    info = mv.thermo_data_values(prof, 0)
    p = info["p_wind"]
    u = info["u"]
    v = info["v"]

    gr_wind = []
    for i in range(len(pres_bins) - 1):

        # collect wind data in bin
        u_val = []
        v_val = []
        for k in range(len(p)):
            if (
                not np.isnan(p[k])
                and not np.isnan(u[k])
                and not np.isnan(v[k])
                and p[k] <= pres_bins[i]
                and p[k] >= pres_bins[i + 1]
            ):
                u_val.append(u[k])
                v_val.append(v[k])

        # build graph object
        if u_val and v_val:
            vis = mv.input_visualiser(input_x_values=u_val, input_y_values=v_val)

            gr = mv.mgraph(
                legend="on",
                graph_line_colour=pres_colours[i],
                graph_line_style="solid",
                graph_line_thickness=5,
            )
            gr_wind.extend([vis, gr])

    return gr_wind


# read BUFR data
filename = "temp.bufr"
if mv.exist(filename):
    b = mv.read(filename)
else:
    b = mv.gallery.load_dataset(filename)

# define station id
statid = "78583"

# extract thermo profile
prof = mv.thermo_bufr(data=b, station=mv.stations(search_key="ident", ident=statid))

# define the hodograph background
hodo_incr = 5
hodo_highlight = [10, 20, 30]
hodo_label = [10, 20, 30]
hodo_max_val = 35
hodo_colour = "RGB(0.4,0.4,0.4)"

# define the wind speed bins and their associated colours
pres_bins = [1050, 700, 500, 300, 200, 50]
pres_colours = ["red", "kelly_green", "sky", "blue", "magenta"]

# generate the graphical objects for the hodograph background
gr_hodo_bg = build_hodo_bg(
    hodo_incr=hodo_incr,
    hodo_highlight=hodo_highlight,
    hodo_label=hodo_label,
    hodo_max_val=hodo_max_val,
    hodo_colour=hodo_colour,
)

# generate the graphical objects for wind data on the hodograph
gr_hodo_wind = build_hodo_wind(prof, pres_bins, pres_colours)

# build the view for the hodograph
view = build_view(hodo_incr=hodo_incr, hodo_max_val=hodo_max_val)

# define legend with custom labels
legend_text = []
for i in range(len(pres_bins) - 1):
    legend_text.append(str(pres_bins[i]) + "-" + str(pres_bins[i + 1]))

legend = mv.mlegend(
    legend_display_type="disjoint",
    legend_text_font_size=0.5,
    legend_text_composition="user_text_only",
    legend_user_lines=legend_text,
)

# define title
info = mv.thermo_data_info(prof)
title_txt = "HODOGRAPH Date: {} {} UTC WMO id: {} Lat/Lon: {:.2f}/{:.2f}".format(
    int(info["date"]), int(info["time"]), int(info["station"]), info["lat"], info["lon"]
)

title = mv.mtext(text_lines=title_txt, text_font_size=0.5, text_colour="charcoal")

# define the output plot file
mv.setoutput(mv.pdf_output(output_name="hodograph"))

# generate the plot
mv.plot(view, gr_hodo_bg, gr_hodo_wind, legend, title)