Note
Click here to download the full example code
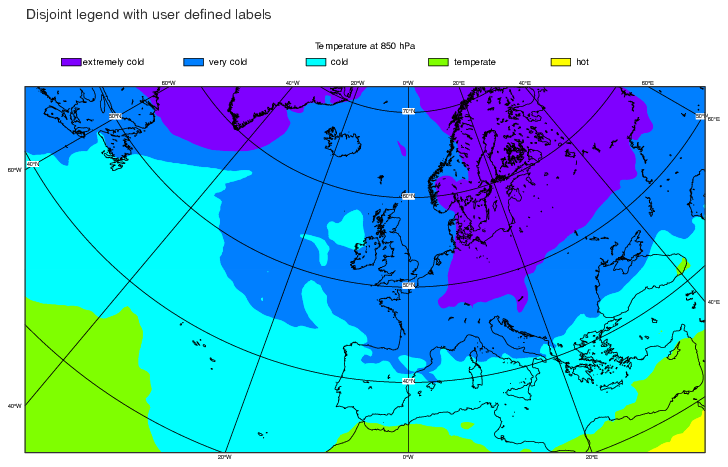
GRIB - Disjoint Legend
# (C) Copyright 2017- ECMWF.
#
# This software is licensed under the terms of the Apache Licence Version 2.0
# which can be obtained at http://www.apache.org/licenses/LICENSE-2.0.
#
# In applying this licence, ECMWF does not waive the privileges and immunities
# granted to it by virtue of its status as an intergovernmental organisation
# nor does it submit to any jurisdiction.
#

# ------------------------------------------------------------------
# Demonstrates how to show a disjoint legend with labels
# for each level value.
# ------------------------------------------------------------------

import metview as mv

# read the input grib file (temperature)
filename = "t850.grb"
if mv.exist(filename):
    my_data = mv.read(filename)
else:
    my_data = mv.gallery.load_dataset(filename)

# set up the geographical view
my_view = mv.geoview(
    map_area_definition="CORNERS",
    map_projection="POLAR_STEREOGRAPHIC",
    area=[21.51, -37.27, 51.28, 65.00],
)

# set up a shade contour with legend for the field
my_contour = mv.mcont(
    contour_level_selection_type="LEVEL_LIST",
    contour_level_list=[-48.0, -10.0, 0.0, 10.0, 20.0, 48.0],
    contour_hilo="OFF",
    contour_label="OFF",
    contour="OFF",
    legend="ON",
    contour_shade="ON",
    contour_shade_colour_method="LIST",
    contour_shade_method="AREA_FILL",
    contour_shade_max_level=48.00,
    contour_shade_min_level=-48.00,
    contour_shade_colour_list=[
        "blue_purple",
        " greenish_blue",
        " blue_green",
        " yellow_green",
        " yellow",
        " orange",
    ],
)

# set up an disjoint legend for the field
my_legend = mv.mlegend(
    legend_display_type="DISJOINT",
    legend_text_composition="USER_TEXT_ONLY",
    legend_title="ON",
    legend_user_lines=["extremely cold", " very cold", " cold", " temperate", " hot"],
    legend_text_font_size=0.4,
    legend_text_colour="BLACK",
    legend_entry_text_width=80.00,
    legend_title_text="Temperature at 850 hPa",
)

# set up the coastlines
my_coast = mv.mcoast(map_coastline_resolution="HIGH")

# set up the title
my_title = mv.mtext(
    text_font_size=0.6,
    text_lines=["Disjoint legend with user defined labels", " "],
    text_justification="LEFT",
    text_colour="CHARCOAL",
)

# define the output plot file
mv.setoutput(mv.pdf_output(output_name="legend2"))

# plot the cartesian graph
mv.plot(my_view, my_data, my_contour, my_coast, my_title, my_legend)