Note
Click here to download the full example code
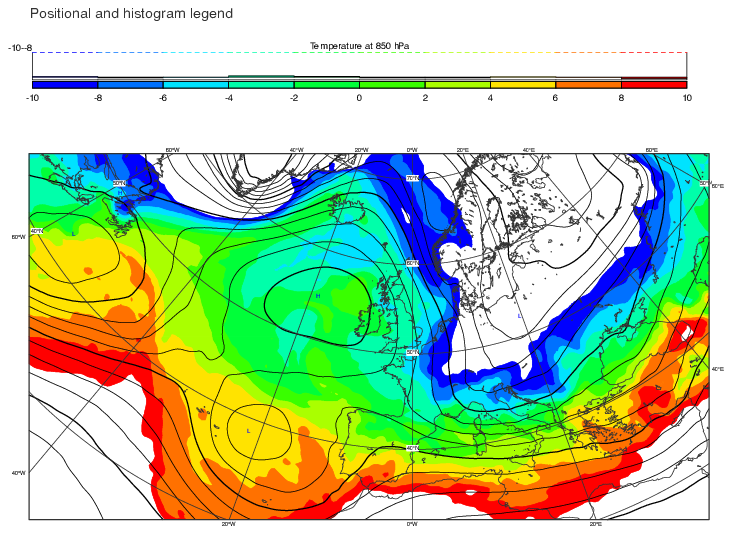
GRIB - Histogram Legend
# (C) Copyright 2017- ECMWF.
#
# This software is licensed under the terms of the Apache Licence Version 2.0
# which can be obtained at http://www.apache.org/licenses/LICENSE-2.0.
#
# In applying this licence, ECMWF does not waive the privileges and immunities
# granted to it by virtue of its status as an intergovernmental organisation
# nor does it submit to any jurisdiction.
#

# ------------------------------------------------------------------
# Demonstrates how to combine two fields into a single plot
# using contour and shade. A histogram legend is used for one
# of the fields.
# ------------------------------------------------------------------

import metview as mv

# read the input grib temperature
filename = "t850.grb"
if mv.exist(filename):
    my_data1 = mv.read(filename)
else:
    my_data1 = mv.gallery.load_dataset(filename)

# read the input grib geopotential
filename = "z500.grb"
if mv.exist(filename):
    my_data2 = mv.read(filename)
else:
    my_data2 = mv.gallery.load_dataset(filename)

# set up the geographical view
my_view = mv.geoview(
    map_area_definition="CORNERS",
    map_projection="POLAR_STEREOGRAPHIC",
    area=[21.51, -37.27, 51.28, 65.00],
)

# set up a shade contour with legend for the temperature field
my_contour1 = mv.mcont(
    contour_level_selection_type="LEVEL_LIST",
    contour_level_list=[-10.0, -8.0, -6.0, -4.0, -2.0, 0.0, 2.0, 4.0, 6.0, 8.0, 10.0],
    contour="OFF",
    contour_label="OFF",
    contour_hilo="OFF",
    legend="ON",
    contour_shade="ON",
    contour_shade_method="AREA_FILL",
    contour_shade_colour_direction="CLOCKWISE",
    contour_shade_max_level_colour="RED",
    contour_shade_min_level_colour="BLUE",
)

# set up a black contour line for the geopotential field
my_contour2 = mv.mcont(
    contour_level_selection_type="INTERVAL",
    contour_line_colour="BLACK",
    contour_line_thickness=1,
    contour_hilo_height=0.25,
    contour_interval=5.00,
    contour_hilo="ON",
    contour_hilo_quality="HIGH",
    contour_highlight_colour="BLACK",
    contour_highlight_thickness=2,
    contour_label="OFF",
    legend="OFF",
)

# set up the coastlines
my_coast = mv.mcoast(
    map_coastline_resolution="HIGH",
    map_grid_colour="CHARCOAL",
    map_grid="ON",
    map_coastline_colour="CHARCOAL",
)

# set up the title
my_title = mv.mtext(
    text_font_size=0.60,
    text_lines=["Positional and histogram legend", "", "", "", "", "", ""],
    text_justification="LEFT",
    text_colour="CHARCOAL",
)

# set up an histogram legend for the temperature field
my_legend = mv.mlegend(
    legend_box_mode="POSITIONAL",
    legend_box_x_position=1.00,
    legend_box_x_length=27.00,
    legend_box_y_position=16.00,
    legend_box_y_length=3.00,
    legend_display_type="HISTOGRAM",
    legend_histogram_max_value="ON",
    legend_label_frequency=1,
    legend_text_font_size=0.40,
    legend_text_colour="BLACK",
    legend_title="ON",
    legend_title_text="Temperature at 850 hPa",
)


# define the output plot file
mv.setoutput(mv.pdf_output(output_name="legend3"))

# plot the map
mv.plot(
    my_view, my_data1, my_contour1, my_data2, my_contour2, my_coast, my_title, my_legend
)