Note
Click here to download the full example code
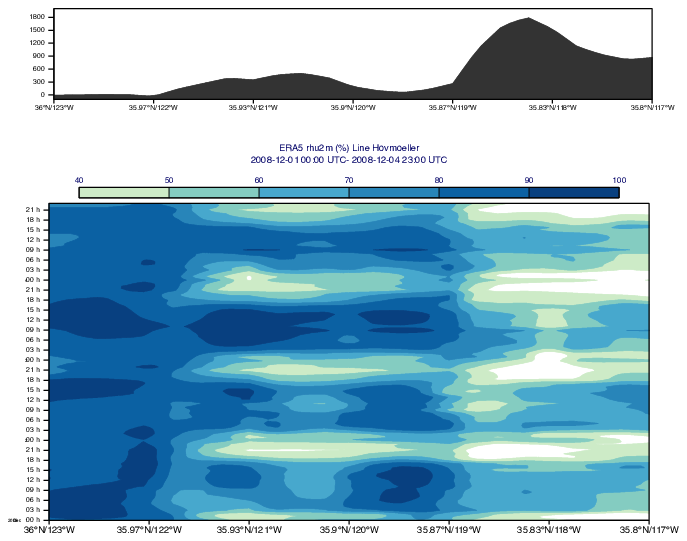
GRIB - Line Hovmoeller with Orography ERA5
# (C) Copyright 2017- ECMWF.
#
# This software is licensed under the terms of the Apache Licence Version 2.0
# which can be obtained at http://www.apache.org/licenses/LICENSE-2.0.
#
# In applying this licence, ECMWF does not waive the privileges and immunities
# granted to it by virtue of its status as an intergovernmental organisation
# nor does it submit to any jurisdiction.
#

import metview as mv

filename = "surf_era5_california.grib"

# getting forecast data from CDS
if False:
    import cdsapi

    c = cdsapi.Client()

    c.retrieve(
        "reanalysis-era5-single-levels",
        {
            "format": "grib",
            "variable": [
                "2m_dewpoint_temperature",
                "2m_temperature",
                "geopotential",
            ],
            "year": [
                "2008",
            ],
            "month": [
                "12",
            ],
            "day": [1, 2, 3, 4],
            "time": list(range(0, 24)),
            "area": [
                40,
                -130,
                20,
                -100,
            ],
            "product_type": "reanalysis",
        },
        filename,
    )
    g = mv.read(filename)
# getting data locally or from file server
else:
    if mv.exist(filename):
        g = mv.read(filename)
    else:
        g = mv.gallery.load_dataset(filename)

# extract fields, scale surface gepotential to m
td = g.select(shortName="2d")
t = g.select(shortName="2t")
zs = g.select(shortName="z")[0] / 9.81

# compute 2m relative humidity (%)
rh = mv.relative_humidity_from_dewpoint(t, td)

# define section line
line = [36, -123, 35.8, -117]

# ---------------------------------------------
#  Define line Hovmoeller
# ---------------------------------------------

# define line Hovmoeller data object
hov_d = mv.mhovmoeller_line(data=rh, line=line)

# define time axis
time_axis = mv.maxis(
    axis_type="date",
    axis_date_type="hours",
    axis_days_label="number",
    axis_hours_label="on",
    axis_hours_label_quality="high",
    axis_hours_label_height=0.3,
)

# define vertical axis
geo_axis = mv.maxis(
    axis_tick_label_height=0.4,
)

# define Hovmoeller view
hov_view = mv.mhovmoellerview(
    type="line_hovm", line=line, time_axis=time_axis, geo_axis=geo_axis
)

# define rhu contours
rhu_cont = mv.mcont(
    legend="on",
    contour="off",
    contour_level_selection_type="interval",
    contour_shade_max_level=100,
    contour_shade_min_level=40,
    contour_interval=10,
    contour_label="off",
    contour_shade="on",
    contour_shade_colour_method="palette",
    contour_shade_method="area_fill",
    contour_shade_palette_name="m_blue_green2_6",
)

# define legend
legend = mv.mlegend(legend_text_font_size=0.35)

# define title
start_dt = mv.base_date(t[0])
end_dt = mv.base_date(t[-1])

title = mv.mtext(
    text_lines=[
        f"ERA5 rhu2m (%) Line Hovmoeller",
        "{} UTC- {} UTC".format(
            start_dt.strftime("%Y-%m-%d %H:%M"), end_dt.strftime("%Y-%m-%d %H:%M")
        ),
        "",
    ],
    text_font_size=0.4,
)

# ---------------------------------------------
#  Define orography section
# ---------------------------------------------

# define orography curve object. It is built from the Hovmoeller
# data object
orog_curve = mv.xs_build_orog(hov_d, zs, -100, "charcoal")

# define cross section view
xs_view = mv.mxsectview(line=line, top_level=2000, bottom_level=-100)

# ---------------------------------------------
#  Define layout
# --------------------------------------------
xs_page = mv.plot_page(bottom=20, left=6, right=94, view=xs_view)
hov_page = mv.plot_page(top=30, view=hov_view)
dw = mv.plot_superpage(pages=[xs_page, hov_page])

# define the output plot file
mv.setoutput(mv.pdf_output(output_name="line_hovm_with_orog_era5"))

# generate plot
mv.plot(dw[0], orog_curve, dw[1], hov_d, rhu_cont, legend, title)