mhovmoeller_line

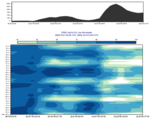
Generates a Hovmoeller diagram data unit for a given transect line for GRIB (Fieldset) input. The generated data can be used to display a two-dimensional graph with latitude or longitude as one axis and time as the other. The point values for each field are interpolated along the transect line, with a spacing consistent with the resolution of the input GRIB data.
The resulting data can be plotted (using a default visualisation and with the plot area based on the range of data values) or saved as a NetCDF data file using write().
If access to the computed values is not required, or for more control of the plotting, use mhovmoellerview().
Note
See also mhovmoeller_area(), mhovmoeller_vertical() and mhovmoeller_expand().
Note
This function performs the same task as the Hovmoeller Data icon in Metview’s user interface. It accepts its parameters as keyword arguments, described below.
- mhovmoeller_line(**kwargs)
Provides input for Hovmoeller diagrams derived from a transect line.
- Parameters
data (
Fieldset) – Specifies the GRIB data (Fieldset) from which to derive the Hovmeller diagram. ``data``must specify a time-series of one meteorological variable on a given level on a latitude-longitude or Gaussian grid. Multiple parameters/levels are not supported.line (list[number], default: [0, -180, 0, 180]) – Specifies the coordinates of a transect line along which the Hovmoeller diagram is calculated in [lat1, lon1, lat2, lon2] format.
swap_axes ({"no", "yes"}, default: "no") – By default, the definition of the vertical and horizontal axes of the Hovmoeller diagrams follows pre-defined rules. However, if
swap_axesis set to “yes” then the axes will be swapped around.resolution (number, default: 1.0) – Used to interpolate the data onto a regular grid, and applies to both the horizontal and vertical axes where appropriate. This parameter is essential for creating a Hovmoeller diagram from satellite data.
- Return type