Note
Click here to download the full example code
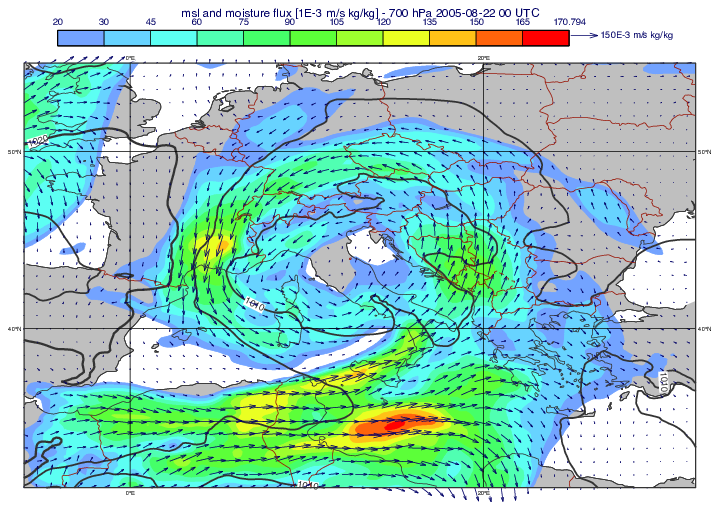
GRIB - Moisture Flux
# (C) Copyright 2017- ECMWF.
#
# This software is licensed under the terms of the Apache Licence Version 2.0
# which can be obtained at http://www.apache.org/licenses/LICENSE-2.0.
#
# In applying this licence, ECMWF does not waive the privileges and immunities
# granted to it by virtue of its status as an intergovernmental organisation
# nor does it submit to any jurisdiction.
#

import metview as mv

# getting data
use_cds = False

filename = "mflux_era5.grib"

if use_cds:
    import cdsapi

    c = cdsapi.Client()
    area = [60, -10, 25, 40]
    filename_sfc = filename + ".part1"
    filename_pl = filename + ".part2"
    days = [22]
    c.retrieve(
        "reanalysis-era5-single-levels",
        {
            "product_type": "reanalysis",
            "format": "grib",
            "variable": [
                "mean_sea_level_pressure",
            ],
            "year": "2005",
            "month": "08",
            "day": 22,
            "time": ["00:00"],
            "area": area,
        },
        filename_sfc,
    )

    c.retrieve(
        "reanalysis-era5-pressure-levels",
        {
            "product_type": "reanalysis",
            "format": "grib",
            "variable": [
                "specific_humidity",
                "u_component_of_wind",
                "v_component_of_wind",
            ],
            "pressure_level": ["700", "850"],
            "year": "2005",
            "month": "08",
            "day": 22,
            "time": ["00:00"],
            "area": area,
        },
        filename_pl,
    )

    g1 = mv.read(filename_sfc)
    g2 = mv.read(filename_pl)
    mv.write(filename, mv.merge(g1, g2))
    g = mv.read(filename)
else:
    if mv.exist(filename):
        g = mv.read(filename)
    else:
        g = mv.gallery.load_dataset(filename)

#  get fields on 700 hpa
level = 700
q = mv.read(data=g, param="q", levelist=level)
u = mv.read(data=g, param="u", levelist=level)
v = mv.read(data=g, param="v", levelist=level)

# get msl
msl = mv.read(data=g, param="msl")

# compute the moisture flux vector and scale it by 1000
mf = mv.merge(u * q, v * q)
mf = mf * 1000

# compute the magnitude of the moisture flux vector
mf_mag = mv.sqrt(mf[0] ** 2 + mf[1] ** 2)

# define moisture flux magnitude style
mf_shade = mv.mcont(
    legend="on",
    contour="off",
    contour_min_level=20,
    contour_label="off",
    contour_shade="on",
    contour_shade_method="area_fill",
    contour_shade_max_level_colour="red",
    contour_shade_min_level_colour="sky",
    contour_shade_colour_direction="clockwise",
)

# define msl contour style
msl_cont = mv.mcont(
    contour_line_thickness=3,
    contour_line_colour="charcoal",
    contour_highlight_colour="charcoal",
    contour_highlight_thickness=4,
    contour_level_selection_type="interval",
    contour_interval=5,
    contour_label_height=0.4,
)

# define moisture flux vector style
mf_vector_style = mv.mwind(
    wind_thinning_factor=3,
    wind_arrow_colour="navy",
    wind_arrow_unit_velocity=150,
    legend="on",
    wind_legend_text="   150E-3 m/s kg/kg",
)

# define coastlines
coast = mv.mcoast(
    map_coastline_colour="charcoal",
    map_coastline_land_shade="on",
    map_coastline_land_shade_colour="RGB(0.749,0.749,0.749)",
    map_boundaries="on",
    map_boundaries_colour="brick",
    map_boundaries_thickness=1,
)

# define view
view = mv.geoview(
    map_area_definition="corners", area=[31, -6, 55, 32], coastlines=coast
)

# define title
vdate = mv.valid_date(q)
title = mv.mtext(
    text_lines=[
        "msl and moisture flux [1E-3 m/s kg/kg] - {} hPa {}".format(
            level, vdate.strftime("%Y-%m-%d %H UTC")
        )
    ],
    text_font_size=0.5,
)

# define legend
legend = mv.mlegend(legend_text_font_size=0.4)

# define output
mv.setoutput(mv.pdf_output(output_name="moisture_flux"))

# generate plot
mv.plot(view, mf_mag, mf_shade, msl, msl_cont, mf, mf_vector_style, title, legend)