Note
Click here to download the full example code
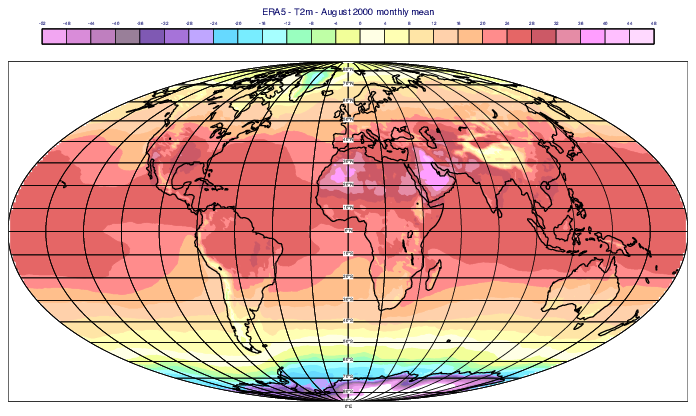
NetCDF - Temperature
# (C) Copyright 2017- ECMWF.
#
# This software is licensed under the terms of the Apache Licence Version 2.0
# which can be obtained at http://www.apache.org/licenses/LICENSE-2.0.
#
# In applying this licence, ECMWF does not waive the privileges and immunities
# granted to it by virtue of its status as an intergovernmental organisation
# nor does it submit to any jurisdiction.
#

import metview as mv

# read ERA5 monthly mean - downloaded from CDS
filename = "era5_2000_aug.nc"
if mv.exist(filename):
    nc = mv.read(filename)
else:
    nc = mv.gallery.load_dataset(filename)


# our NetCDF data is CF-compliant and has the following
# structure:
#
# dimensions:
# 	longitude = 1440 ;
# 	latitude = 721 ;
# 	time = 1 ;
# variables:
# 	float longitude(longitude) ;
# 	float latitude(latitude) ;
# 	int time(time) ;
# 	short t2m(time, latitude, longitude) ;

# define netcdf plotting based on the data structure above
vis = mv.netcdf_visualiser(
    netcdf_plot_type="geo_matrix",
    netcdf_latitude_variable="latitude",
    netcdf_longitude_variable="longitude",
    netcdf_value_variable="t2m",
    netcdf_data=nc,
)

# define contour shading
cont = mv.mcont(
    contour_automatic_setting="style_name",
    contour_style_name="sh_all_fM52t48i4_light",
    legend="on",
)

# define coastlines
coastlines = mv.mcoast(map_coastline_thickness=2, map_label_height=0.2)

# define projection
view = mv.geoview(
    map_projection="mollweide", subpage_clipping="on", coastlines=coastlines
)

# define title
title = mv.mtext(
    text_lines=["ERA5 - T2m - August 2000 monthly mean"], text_font_size=0.4
)

# define output
mv.setoutput(mv.pdf_output(output_name="nc_era5_t2"))

# generate plot
mv.plot(view, vis, cont, title)