Note
Click here to download the full example code
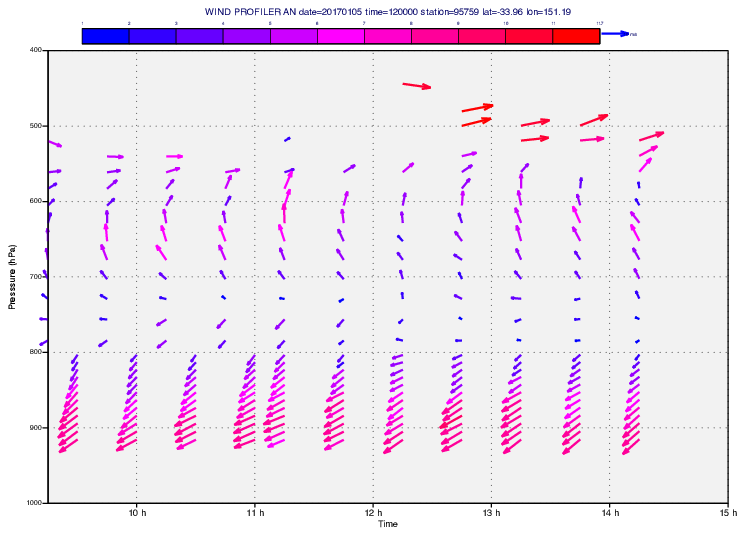
ODB - Wind Profiler
# (C) Copyright 2017- ECMWF.
#
# This software is licensed under the terms of the Apache Licence Version 2.0
# which can be obtained at http://www.apache.org/licenses/LICENSE-2.0.
#
# In applying this licence, ECMWF does not waive the privileges and immunities
# granted to it by virtue of its status as an intergovernmental organisation
# nor does it submit to any jurisdiction.
#

import metview as mv
from datetime import datetime

# read db
filename = "wprof.odb"
if mv.exist(filename):
    db = mv.read(filename)
else:
    db = mv.gallery.load_dataset(filename)

# define station id
statid = "95759"

# define query for u wind component
q_u = """select obsvalue as val,
      vertco_reference_1 as p,
      date@hdr as date,
      time@hdr as time
      where varno=3 and statid='{}'""".format(
    statid
)

# define query for v wind component
q_v = """select obsvalue as val,
      vertco_reference_1 as p,
      date as d,
      time as t
      where varno=4 and statid='{}'""".format(
    statid
)

# define query for metadata
q_meta = """select DISTINCT lat@hdr as lat, lon@hdr as lon, andate,
      antime where statid='{}'""".format(
    statid
)

# filter u
f_u = mv.odb_filter(odb_query=q_u, odb_data=db)

# filter v
f_v = mv.odb_filter(odb_query=q_v, odb_data=db)

# filter metadata
f_m = mv.odb_filter(odb_query=q_meta, odb_data=db)

# read the odb columns into vectors
u = mv.values(f_u, "val")
d = mv.values(f_u, "date")
t = mv.values(f_u, "time")
p = mv.values(f_u, "p") / 100  # pressure is converted to hPa
v = mv.values(f_v, "val")

# read valus for the title
lat = mv.values(f_m, "lat")[0]
lon = mv.values(f_m, "lon")[0]
andate = mv.values(f_m, "andate")[0]
antime = mv.values(f_m, "antime")[0]

# build datetime list
d_lst = []
for i, d_val in enumerate(d):
    tt = str(int(t[i]))
    if len(tt) == 5:
        tt = "0" + tt

    d_lst.append(datetime.strptime(str(int(d_val)) + tt, "%Y%m%d%H%M%S"))


# define an input visualisers
vis = mv.input_visualiser(
    input_plot_type="xy_vectors",
    input_x_type="date",
    input_y_type="number",
    input_date_x_values=d_lst,
    input_y_values=list(p),
    input_x_component_values=list(u),
    input_y_component_values=list(v),
)

# wind plotting style
wp = mv.mwind(
    wind_thinning_factor=1.0,
    legend="on",
    wind_advanced_method="on",
    wind_advanced_colour_selection_type="interval",
    wind_advanced_colour_min_value=1,
    wind_advanced_colour_level_interval=1,
    wind_advanced_colour_max_level_colour="red",
    wind_advanced_colour_min_level_colour="blue",
    wind_arrow_thickness=2,
    wind_arrow_unit_velocity=10,
)

# define title
title = mv.mtext(
    text_font_size=0.4,
    text_line_1="""WIND PROFILER AN date={:.0f} time={:.0f} station={} lat={:.2f} lon={:.2f}""".format(
        andate, antime, statid, lat, lon
    ),
)

# horizontal axis
h_axis = mv.maxis(
    axis_position="left",
    axis_title_text="Time",
    axis_minor_tick="on",
    axis_minor_tick_count=5,
    axis_date_type="hours",
    axis_hours_label="on",
    axis_hours_label_height=0.4,
    axis_grid="on",
    axis_grid_colour="charcoal",
    axis_grid_line_style="dot",
)

# vertical axis
v_axis = mv.maxis(
    axis_orientation="vertical",
    axis_title_text="Presssure (hPa)",
    axis_grid="on",
    axis_grid_colour="charcoal",
    axis_grid_line_style="dot",
)

# the view
view = mv.cartesianview(
    x_automatic="on",
    x_axis_type="date",
    y_automatic="off",
    y_min=1000,
    y_max=400,
    y_automatic_reverse="on",
    horizontal_axis=h_axis,
    vertical_axis=v_axis,
    subpage_background_colour="RGB(0.95,0.95,0.95)",
)

# define the output plot file
mv.setoutput(mv.pdf_output(output_name="odb_wind_profiler"))

# generate the plot
mv.plot(view, vis, wp, title)