Note
Click here to download the full example code
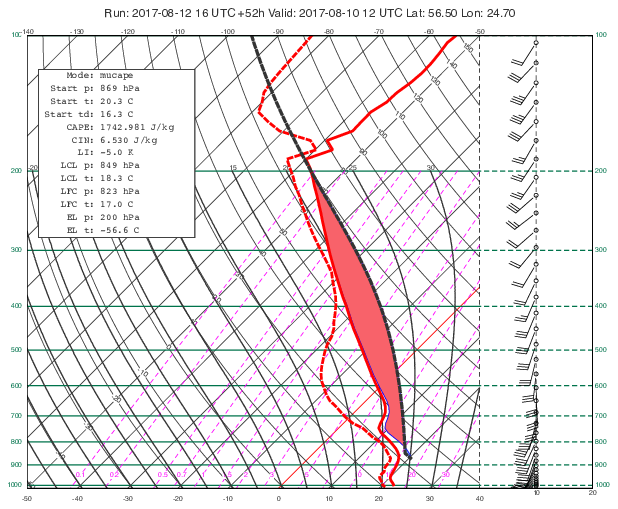
GRIB - Parcel with Maximum CAPE on Skew-T
# (C) Copyright 2017- ECMWF.
#
# This software is licensed under the terms of the Apache Licence Version 2.0
# which can be obtained at http://www.apache.org/licenses/LICENSE-2.0.
#
# In applying this licence, ECMWF does not waive the privileges and immunities
# granted to it by virtue of its status as an intergovernmental organisation
# nor does it submit to any jurisdiction.
#

import metview as mv

# Note: at least Metview version 5.17.0 is required

# getting data
use_mars = False

# getting forecast data from MARS
if use_mars:
    # a single timestep
    g = mv.retrieve(
        type="fc",
        levtype="ml",
        levelist=[1, "to", 137],
        param=["t", "q", "u", "v", "lnsp"],
        date=20170810,
        step=52,
        area=[52, 22, 58, 26],
        grid=[0.1, 0.1],
    )
# read data from file
else:
    filename = "max_cape_prof.grib"
    if mv.exist(filename):
        g = mv.read(filename)
    else:
        g = mv.gallery.load_dataset(filename)

# extract thermo profile
location = [56.5, 24.7]  # lat, lon
prof = mv.thermo_grib(coordinates=location, data=g)

# compute parcel path - maximum cape up to 700 hPa
parcel = mv.thermo_parcel_path(prof, mode="mucape", top_p=700)

# create plot object for parcel areas
parcel_area = mv.thermo_parcel_area(parcel)

# create plot object for parcel path
parcel_vis = mv.xy_curve(parcel["t"], parcel["p"], "charcoal", "dash", 6)

# define t and td profile style
prof_vis = mv.mthermo(
    thermo_temperature_line_thickness=5, thermo_dewpoint_line_thickness=5
)

# define the thermodynamic view
view = mv.thermoview(
    type="skewt",
    minimum_temperature=-140,
    maximum_temperature=40,
    top_pressure=100,
    subpage_clipping="on",
)

# get profile info for title
info = mv.thermo_data_info(prof)

# define title
title_txt = "Run: {} UTC +{}h Valid: {} UTC Lat: {:.2f} Lon: {:.2f}".format(
    info["valid_date"].strftime("%Y-%m-%d %H"),
    int(info["step"]),
    info["base_date"].strftime("%Y-%m-%d %H"),
    info["lat"],
    info["lon"],
)

title = mv.mtext(text_lines=title_txt, text_font_size=0.5, text_colour="charcoal")

# define text lines for info box
txt = []
txt.append("     Mode: " + parcel["start"]["mode"])
txt.append("  Start p: {:.0f} hPa".format(parcel["start"]["p"]))
txt.append("  Start t: {:.1f} C".format(parcel["start"]["t"]))
txt.append(" Start td: {:.1f} C".format(parcel["start"]["td"]))
txt.append("     CAPE: {:.3f} J/kg".format(parcel["cape"]))
txt.append("      CIN: {:.3f} J/kg".format(parcel["cin"]))
txt.append("       LI: {:.1f} K".format(parcel["li"]))

if parcel["lcl"] is not None:
    txt.append("    LCL p: {:.0f} hPa".format(parcel["lcl"]["p"]))
    txt.append("    LCL t: {:.1f} C".format(parcel["lcl"]["t"]))

if parcel["lfc"] is not None:
    txt.append("    LFC p: {:.0f} hPa".format(parcel["lfc"]["p"]))
    txt.append("    LFC t: {:.1f} C".format(parcel["lfc"]["t"]))

if parcel["el"] is not None:
    txt.append("     EL p: {:.0f} hPa".format(parcel["el"]["p"]))
    txt.append("     EL t: {:.1f} C".format(parcel["el"]["t"]))


# create info box - ensure font is monospace
info_box = mv.mtext(
    text_lines=txt,
    text_font="courier",
    text_font_size=0.4,
    text_colour="charcoal",
    text_justification="left",
    text_mode="positional",
    text_box_x_position=4,
    text_box_y_position=11.4,
    text_box_x_length=5.8,
    text_box_y_length=len(txt) * 0.45 + 0.4,
    text_box_blanking="on",
    text_border="on",
    text_border_colour="charcoal",
)

# define the output plot file
mv.setoutput(mv.pdf_output(output_name="parcel_path_max_cape"))

# plot the profile, parcel areas, parcel path and info box together
mv.plot(view, parcel_area, prof, prof_vis, parcel_vis, title, info_box)