thermo_grib

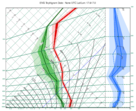
Generates a thermodynamic diagram data unit from GRIB data (Fieldset). In a thermodynamic diagram temperature, humidity (represented by the dew point) and wind values are displayed with respect to pressure. Metview supports the following diagram types: Tephigram, Skew-T and Emagram (see thermoview()).
The resulting data can be visualised with plot() or saved as a NetCDF data file using write().
If access to the output data values is not required, or for more control of the plotting, use thermoview().
Note
This function performs the same task as the Thermo Data icon in Metview’s user interface. It accepts its parameters as keyword arguments, described below.
- thermo_grib(**kwargs)
Generates a thermodynamic diagram data unit from GRIB data.
- Parameters
data (
Fieldset) – Specifies the input GRIB data. It should include gridded fields of temperature and specific humidity. These parameters must have the same number of levels and they will be used to compute the dew point. u and v wind component fields are optional, but if given a wind profile will be plotted in the thermodynamic view. These two components must have the same number of levels, but not necessarily have the same number of levels of temperature and specific humidity. If the data is given on ECMWF model levels then a Logarithm of Surface Pressure (LNSP) field must be provided too.point_selection ({"coordinates", "area_average", "station"}, default: "coordinates") – Specifies how the geographical location, for which the diagram is to be plotted, will be selected.
coordinates (list, default: [0, 0]) – Specifies the geographical location (as [lat, lon]) for which the diagram is to be plotted. Available when
point_selectionis “coordinates”.area_average (list, default: [30, -30, -30, 30]) – Specifies a geographical area over which an area average value will be used, instead of a point value, to produce the diagram. The area is defined as [north, west, south, east]. Available when
point_selectionis “area_average”.station (
stations()) – Specifies the location as astations()object for which the diagram is to be plotted. Available ifpoint_selectionis “station”.point_extraction ({"interpolate", "nearest_gridpoint"}, default: "interpolate") –
Specifies the way to calculate values at the point location for GRIB thermodynamic diagrams. The possible options are:
”interpolate”: interpolate values from the four surrounding grid points
”nearest_gridpoint”: use the data from the nearest grid point
dew_point_formulation ({"saturation_over_water", "mixed_phase_0_to_-23"}, default: "saturation_over_water") – Specifies the equation to compute the dew point.
temperature_param (number, default: 130) – Specifies the ecCodes paramId used to identify the temperature in the input data.
specific_humidity_param (number, default: 133) – Specifies the ecCodes paramId used to identify the specific humidity in the input data.
lnsp_param (number, default: 152) – Specifies the ecCodes paramId used to identify the Logarithm of Surface Pressure (LNSP) in the input data.
u_wind_param (number, default: 131) – Specifies the ecCodes paramId used to identify the U wind component in the input data.
v_wind_param (number, default: 132) – Specifies the ecCodes paramId used to identify the V wind component in the input data.
- Return type