Note
Click here to download the full example code
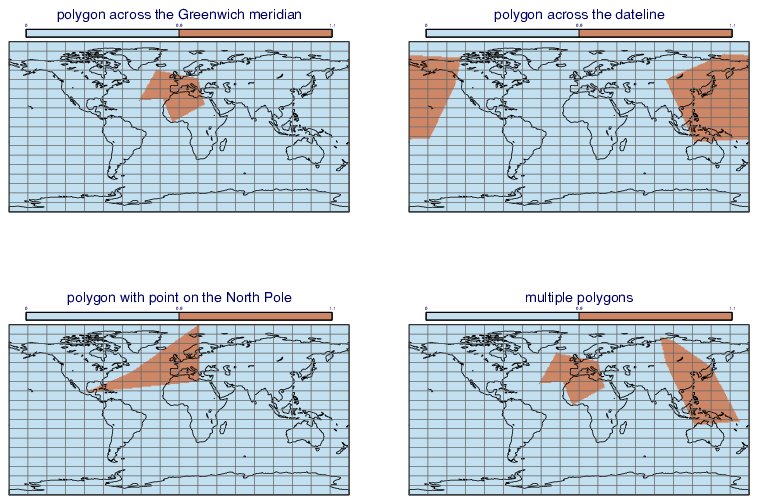
GRIB - Polygon Masking
# (C) Copyright 2021- ECMWF.
#
# This software is licensed under the terms of the Apache Licence Version 2.0
# which can be obtained at http://www.apache.org/licenses/LICENSE-2.0.
#
# In applying this licence, ECMWF does not waive the privileges and immunities
# granted to it by virtue of its status as an intergovernmental organisation
# nor does it submit to any jurisdiction.
#

import metview as mv
import numpy as np

# Note: at least Metview version 5.16.0 is required

# read the input grib file
# regular lat-lon 1x1 degree
filename = "2m_temperature.grib"
if mv.exist(filename):
    f = mv.read(filename)
else:
    f = mv.gallery.load_dataset(filename)

# 0: polygon across the 0 meridian
lon = np.array([-42, -24, 20, 27, -7, -17])
lat = np.array([28, 60, 51, 24, 5, 30])
r0 = mv.poly_mask(f, lat, lon)

# 1: polygon across the dateline
lon = np.array([92, 122, 202, 229, 235, 154, 92])
lat = np.array([50, -16, -12, 45, 73, 77, 50])
r1 = mv.poly_mask(f, lat, lon)

# 2: polygon with point on the North Pole
lon = np.array([-100, 21, 21, -50])
lat = np.array([18, 30, 90, 40])
r2 = mv.poly_mask(f, lat, lon)

# 3: multiple polygons
lon = [np.array([-42, -24, 20, 27, -7, -17]), np.array([92, 122, 170, 140, 100, 86])]
lat = [np.array([28, 60, 51, 24, 5, 30]), np.array([50, -16, -12, 45, 73, 77])]
r3 = mv.poly_mask(f, lat, lon)

# grid shading for mask (0 and 1) values
grid_shading_01 = mv.mcont(
    legend="on",
    contour="off",
    contour_level_selection_type="level_list",
    contour_level_list=[0, 0.9, 1.1],
    contour_label="off",
    contour_shade="on",
    contour_shade_technique="grid_shading",
    contour_shade_colour_method="list",
    contour_shade_colour_list=["RGB(0.765,0.8789,0.9448)", "RGB(0.8074,0.5293,0.4004)"],
)

# define coastlines
coast = mv.mcoast(
    map_coastline_resolution="low",
    map_coastline_colour="black",
    map_grid_colour="RGB(0.4,0.4,0.4)",
    map_label="off",
)

# define geographical view
gview = mv.geoview(coastlines=coast)

# utility function to return a title object
def t(text):
    return mv.mtext(text_line_1=text, text_font_size=0.6)


# define display window
dw = mv.plot_superpage(pages=mv.mvl_regular_layout(gview, 2, 2, 1, 1))

# define the output plot file
mv.setoutput(mv.pdf_output(output_name="polygon_masking"))

# generate plot
mv.plot(
    dw[0],
    r0,
    grid_shading_01,
    t("polygon across the Greenwich meridian"),
    dw[1],
    r1,
    grid_shading_01,
    t("polygon across the dateline"),
    dw[2],
    r2,
    grid_shading_01,
    t("polygon with point on the North Pole"),
    dw[3],
    r3,
    grid_shading_01,
    t("multiple polygons"),
)