Note
Click here to download the full example code
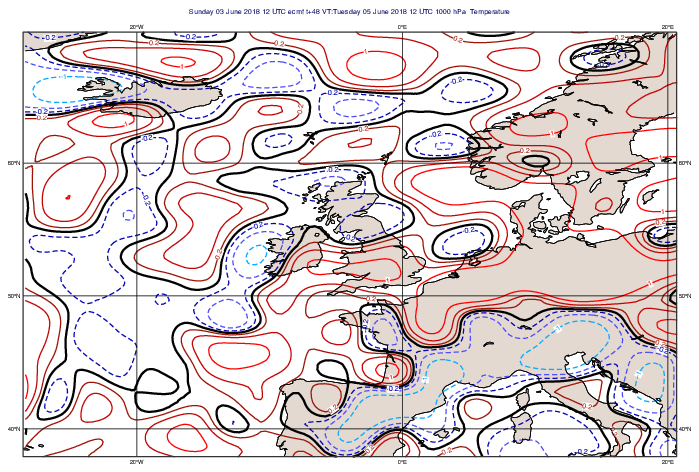
GRIB - Difference Plot with Rainbow Contour Settings
# (C) Copyright 2017- ECMWF.
#
# This software is licensed under the terms of the Apache Licence Version 2.0
# which can be obtained at http://www.apache.org/licenses/LICENSE-2.0.
#
# In applying this licence, ECMWF does not waive the privileges and immunities
# granted to it by virtue of its status as an intergovernmental organisation
# nor does it submit to any jurisdiction.
#

# ---------------------------------------------------------------
# Demonstrates how to use Rainbow contouring to
# separately contour positive, negative and zero
# differences, similar to the Split Contour facility
# which existed in Metview 3.
# ---------------------------------------------------------------

import metview as mv

# retrieve the forecast and analysis data and compute the difference
use_mars = False
if use_mars:
    analysis_data = mv.retrieve(param="t", levelist=1000, grid=[1.5, 1.5], date=-10)
    forecast_data = mv.retrieve(
        param="t", levelist=1000, grid=[1.5, 1.5], date=-12, type="fc", step=48
    )
else:
    filename = "an_data_for_diff.grib"
    if mv.exist(filename):
        analysis_data = mv.read(filename)
    else:
        analysis_data = mv.gallery.load_dataset(filename)

    filename = "fc_data_for_diff.grib"
    if mv.exist(filename):
        forecast_data = mv.read(filename)
    else:
        forecast_data = mv.gallery.load_dataset(filename)


difference = forecast_data - analysis_data

# define the contouring visdef
split = mv.mcont(
    contour_line_thickness=2,
    contour_line_colour_rainbow="on",
    contour_line_colour_rainbow_method="list",
    contour_line_colour_rainbow_colour_list=[
        "RGB(0.02,0.67,1)",
        "RGB(0.31,0.31,0.98)",
        "RGB(0.024,0.024,0.7)",
        "BLACK",
        "RGB(0.62,0.077,0.028)",
        "RGB(0.77,0.019,0.019)",
        "RED",
    ],
    contour_line_thickness_rainbow_list=[2, 2, 2, 4, 2, 2, 2],
    contour_line_style_rainbow_list=[
        "dash",
        "dash",
        "dash",
        "solid",
        "solid",
        "sold",
        "solid",
    ],
    contour_highlight="off",
    contour_level_selection_type="level_list",
    contour_level_list=[-1, -0.5, -0.2, 0, 0.2, 0.5, 1],
)

# define the coastlines visdef and the view
land_sea_shade = mv.mcoast(
    map_coastline_land_shade="on", map_coastline_land_shade_colour="RGB(0.89,0.85,0.82)"
)

view = mv.geoview(
    map_area_definition="corners",
    area=[37.9, -28.57, 69.85, 20.65],
    coastlines=land_sea_shade,
)

# define the output plot file (extension will be added automatically)
# - remove this line to get an interactive plot window
mv.setoutput(mv.pdf_output(output_name="rainbow_contour_diffs"))

# into the view, plot the difference field with the 'split' visdef
mv.plot(view, difference, split)