Note
Click here to download the full example code
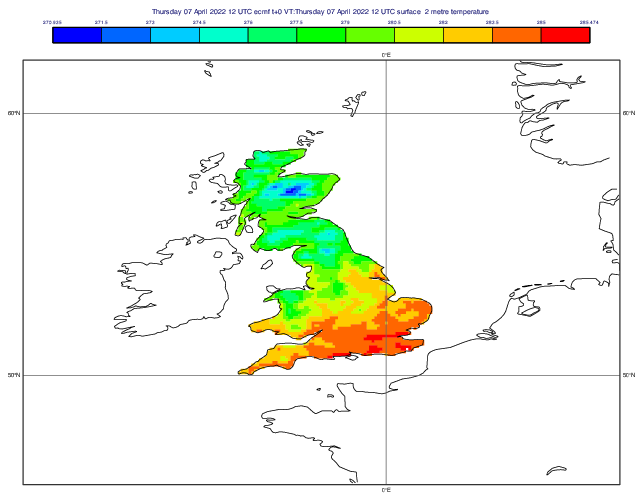
GRIB - Shapefile Masking
# (C) Copyright 2021- ECMWF.
#
# This software is licensed under the terms of the Apache Licence Version 2.0
# which can be obtained at http://www.apache.org/licenses/LICENSE-2.0.
#
# In applying this licence, ECMWF does not waive the privileges and immunities
# granted to it by virtue of its status as an intergovernmental organisation
# nor does it submit to any jurisdiction.
#

import numpy as np
import shapefile  # pypi package 'pyshp'
import metview as mv

# Note: at least Metview version 5.16.0 is required

# read the input grib file
# regular lat-lon 1x1 degree
filename = "t2m_hires_area.grib"
if mv.exist(filename):
    f = mv.read(filename)
else:
    f = mv.gallery.load_dataset(filename)


# get the location of the Natural Earth shapefiles that Magics uses for its coastlines
maghome = mv.getenv("MAGPLUS_HOME")
sf = shapefile.Reader(maghome + "/share/magics/50m/ne_50m_land.shp")

# extract the list of points for the Great Britain polygon
shapes = sf.shapes()
points = shapes[135].points  # GB
lats = np.array([p[1] for p in points])
lons = np.array([p[0] for p in points])

# mask the data to this polygon (at least Metview version 5.16.0 is required)
m = mv.poly_mask(f, lats, lons, missing=True)

# contouring - grid shading to ensure it fills all the way towards missing values
grid_shading = mv.mcont(
    legend="on",
    contour="off",
    contour_label="off",
    contour_shade="on",
    contour_shade_technique="grid_shading",
    contour_shade_min_level_colour="blue",
    contour_shade_max_level_colour="red",
    contour_shade_colour_direction="clockwise",
)

# define coastlines
coast = mv.mcoast(
    map_coastline_colour="black",
    map_grid_colour="RGB(0.4,0.4,0.4)",
    # map_label="off",
)

# define geographical view
gview = mv.geoview(
    coastlines=coast, map_area_definition="corners", area=[45.83, -13.87, 62.03, 8.92]
)

# define the output plot file
mv.setoutput(mv.pdf_output(output_name="shapefile_masking"))

# generate plot
mv.plot(gview, m, grid_shading)