Note
Click here to download the full example code
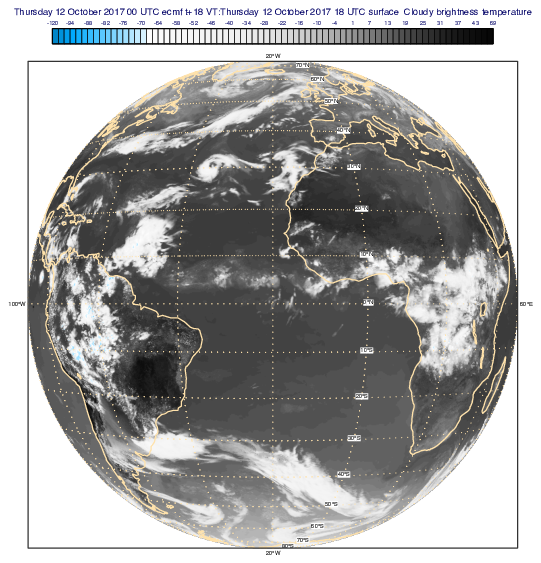
GRIB - Simulated Satellite Image
# (C) Copyright 2017- ECMWF.
#
# This software is licensed under the terms of the Apache Licence Version 2.0
# which can be obtained at http://www.apache.org/licenses/LICENSE-2.0.
#
# In applying this licence, ECMWF does not waive the privileges and immunities
# granted to it by virtue of its status as an intergovernmental organisation
# nor does it submit to any jurisdiction.
#

import metview as mv

# read simulated satellite image
filename = "sim_ir9.grib"
if mv.exist(filename):
    g = mv.read(filename)
else:
    g = mv.gallery.load_dataset(filename)

# define automatic contour shading
shading = mv.mcont(contour_automatic_setting="ecmwf", legend="on")

# define coastlines
coastlines = mv.mcoast(
    map_coastline_colour="cream",
    map_coastline_thickness=2,
    map_grid_line_style="dot",
    map_grid_colour="cream",
)

# define map projection
view = mv.geoview(
    map_projection="geos",
    map_vertical_longitude=-20,
    subpage_x_position=20,
    subpage_y_position=3,
    subpage_x_length=86,
    subpage_y_length=86,
    coastlines=coastlines,
)

# define legend
legend = mv.mlegend(legend_text_font_size=0.25, legend_label_frequency=3)

# define title
title = mv.mtext(text_font_size=0.4)

# define the output plot file
mv.setoutput(mv.pdf_output(output_name="simulated_sat_img"))

# generate plot
mv.plot(view, g, shading, legend, title)