Note
Click here to download the full example code
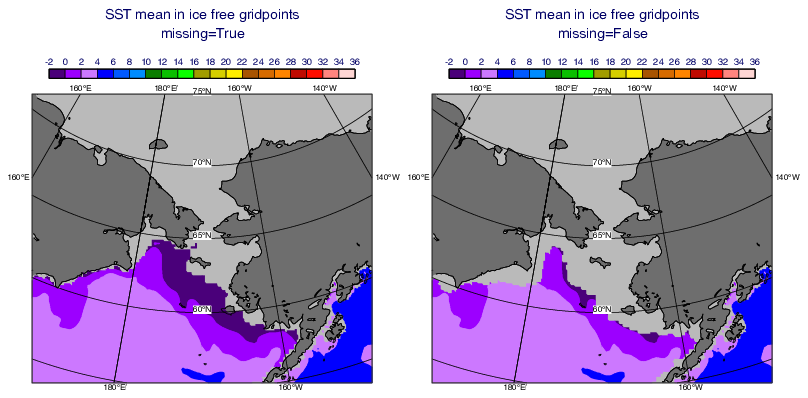
GRIB - SST Mean with Missing Values
# (C) Copyright 2017- ECMWF.
#
# This software is licensed under the terms of the Apache Licence Version 2.0
# which can be obtained at http://www.apache.org/licenses/LICENSE-2.0.
#
# In applying this licence, ECMWF does not waive the privileges and immunities
# granted to it by virtue of its status as an intergovernmental organisation
# nor does it submit to any jurisdiction.
#

import metview as mv

# Note: at least Metview version 5.16.0 is required

# getting the data
use_cds = False

filename = "era5_sst_ci.grib"

# getting ERA5 data from CDS
if use_cds:
    import cdsapi

    c = cdsapi.Client()
    c.retrieve(
        "reanalysis-era5-single-levels",
        {
            "product_type": "reanalysis",
            "format": "grib",
            "variable": ["sea_ice_cover", "sea_surface_temperature"],
            "year": "2018",
            "month": "03",
            "day": list(range(1, 16, 1)),
            "time": "12:00",
        },
        filename,
    )

# read GRIB data from file
else:
    if mv.exist(filename):
        g = mv.read(filename)
    else:
        g = mv.gallery.load_dataset(filename)

# extract sst and sea ice fraction each containing 15 fields
sst = g.select(shortName="sst")
ci = g.select(shortName="ci")

# set sst values to missing where there is sea ice
sst_ice_free = mv.bitmap(sst, mv.bitmap(ci > 0, 1))

# compute mean in two different ways. To use the missing argument
# in mean() at least Metview version 5.16.0 is required
sst_mean_t = mv.mean(sst_ice_free, missing=True)
sst_mean_f = mv.mean(sst_ice_free, missing=False)

# define sst contour shading
sst_shade = mv.mcont(
    contour_automatic_setting="ecmwf", grib_scaling_of_derived_fields="on", legend="on"
)

# define coastlines
coast = mv.mcoast(
    map_coastline_resolution="medium",
    map_coastline_land_shade="on",
    map_coastline_land_shade_colour="RGB(0.4314,0.4314,0.4314)",
    map_coastline_sea_shade="on",
    map_coastline_sea_shade_colour="RGB(0.7294,0.7294,0.7294)",
    map_label_height=0.35,
    map_grid_latitude_increment=5,
)

# define geo view
view = mv.geoview(
    map_projection="polar_stereographic",
    map_area_definition="centre",
    map_vertical_longitude=-170,
    map_centre_latitude=65,
    map_centre_longitude=-170,
    map_scale=2e7,
    coastlines=coast,
)

# define titles
txt_shared = "SST mean in ice free gridpoints"
title_t = mv.mtext(text_lines=[txt_shared, "missing=True", ""], text_font_size=0.6)
title_f = mv.mtext(text_lines=[txt_shared, "missing=False", ""], text_font_size=0.6)

# define legend
legend = mv.mlegend(legend_text_font_size=0.4)

# define layout
page_0 = mv.plot_page(top=20, bottom=80, right=50, view=view)
page_1 = mv.plot_page(top=20, bottom=80, left=50, right=100, view=view)
dw = mv.plot_superpage(page=[page_0, page_1])

# define the output plot file
mv.setoutput(mv.pdf_output(output_name="sst_mean_with_missing_value"))

# generate plot
mv.plot(
    dw[0],
    sst_mean_t,
    sst_shade,
    legend,
    title_t,
    dw[1],
    sst_mean_f,
    sst_shade,
    legend,
    title_f,
)