Note
Click here to download the full example code
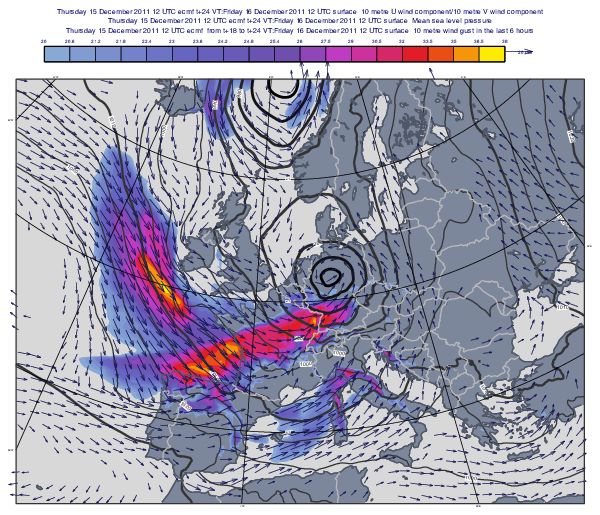
GRIB - Windgust and MSLP with 10m Wind
# (C) Copyright 2017- ECMWF.
#
# This software is licensed under the terms of the Apache Licence Version 2.0
# which can be obtained at http://www.apache.org/licenses/LICENSE-2.0.
#
# In applying this licence, ECMWF does not waive the privileges and immunities
# granted to it by virtue of its status as an intergovernmental organisation
# nor does it submit to any jurisdiction.
#

import metview as mv

# read grib forecasts fields
filename = "joachim_surf.grib"
if mv.exist(filename):
    g = mv.read(filename)
else:
    g = mv.gallery.load_dataset(filename)

# define isoline shading for windgust
wgust_shade = mv.mcont(
    legend="on",
    contour="off",
    contour_level_selection_type="level_list",
    contour_level_list=[20, 26, 38],
    contour_label="off",
    contour_shade="on",
    contour_shade_colour_method="gradients",
    contour_shade_method="area_fill",
    contour_gradients_colour_list=[
        "RGB(0.5325,0.6606,0.8401)",
        "RGB(0.4321,0.3081,0.6801)",
        "RGB(1,0.917,0.003922)",
    ],
    contour_gradients_waypoint_method="left",
    contour_gradients_technique="hsl",
    contour_gradients_technique_direction="anti_clockwise",
    contour_gradients_step_list=[10, 8],
)

# define contours for MSLP
mslp_sub_990 = mv.mcont(
    contour_line_thickness=5,
    contour_line_colour_rainbow="on",
    contour_line_colour_rainbow_max_level_colour="charcoal",
    contour_line_colour_rainbow_min_level_colour="black",
    contour_line_colour_rainbow_direction="clockwise",
    contour_highlight="off",
    contour_level_selection_type="level_list",
    contour_level_list=[970, 975, 980, 985],
    contour_label_height=0.22,
)

mslp_990 = mv.mcont(
    contour_line_thickness=2,
    contour_line_colour="charcoal",
    contour_reference_level=990,
    contour_highlight_colour="charcoal",
    contour_highlight_thickness=4,
    contour_level_selection_type="interval",
    contour_min_level=990,
    contour_interval=5,
    contour_label_height=0.22,
    grib_scaling_of_derived_fields="on",
)

# define wind plotting for wind 10m
wind_plotting = mv.mwind(
    wind_thinning_factor=4,
    legend="on",
    wind_arrow_colour="RGB(0.08476,0.08476,0.3309)",
    wind_arrow_min_speed=5,
    wind_arrow_unit_velocity=20,
)

# define coastlines
coastlines = mv.mcoast(
    map_coastline_colour="RGB(0.3127,0.3447,0.4089)",
    map_coastline_thickness=2,
    map_coastline_resolution="medium",
    map_coastline_land_shade="on",
    map_coastline_land_shade_colour="RGB(0.4854,0.5278,0.6127)",
    map_coastline_sea_shade="on",
    map_coastline_sea_shade_colour="RGB(0.8471,0.8471,0.8471)",
    map_boundaries="on",
    map_boundaries_colour="RGB(0.7294,0.7294,0.7294)",
    map_boundaries_thickness=2,
    map_label_height=0.1,
)

# define geographical view
view = mv.geoview(
    map_projection="polar_stereographic",
    map_area_definition="corners",
    area=[31.14, -18.25, 56.63, 54.87],
    map_vertical_longitude=4,
    coastlines=coastlines,
)

# filter fields to be plotted
wg = mv.read(data=g, param="10fg6", step=24)
mslp = mv.read(data=g, param="msl", step=24)
wind10 = mv.read(data=g, param=["10u", "10v"], step=24)

# define the output plot file
mv.setoutput(mv.pdf_output(output_name="storm_joachim"))

# generate plot
mv.plot(view, wg, wgust_shade, mslp, mslp_990, mslp_sub_990, wind10, wind_plotting)