Note
Click here to download the full example code
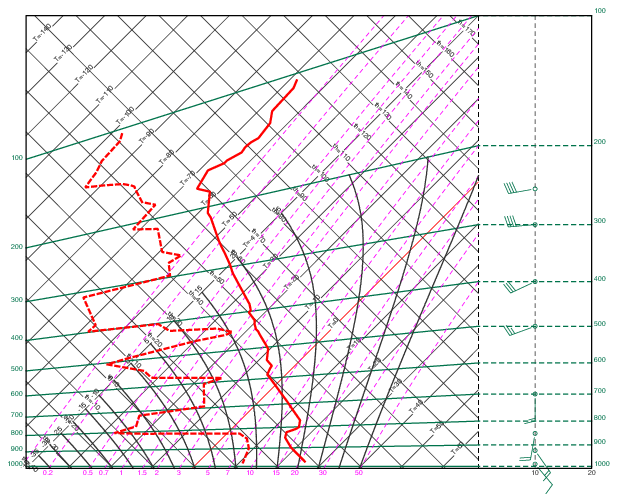
Tephigram from List Data
# (C) Copyright 2017- ECMWF.
#
# This software is licensed under the terms of the Apache Licence Version 2.0
# which can be obtained at http://www.apache.org/licenses/LICENSE-2.0.
#
# In applying this licence, ECMWF does not waive the privileges and immunities
# granted to it by virtue of its status as an intergovernmental organisation
# nor does it submit to any jurisdiction.
#

import metview as mv

# Define set of values to be used as an input to thephigram

# Temperature definition
tempdata = mv.input_visualiser(
    input_x_values=[
        25.8,
        18.8,
        15.0,
        14.0,
        15.4,
        15.8,
        14.4,
        9.6,
        7.0,
        -2.5,
        -4.5,
        -5.3,
        -5.5,
        -8.1,
        -10.5,
        -12.1,
        -16.1,
        -17.1,
        -18.1,
        -19.7,
        -20.5,
        -23.9,
        -23.9,
        -25.7,
        -37.3,
        -39.7,
        -44.1,
        -45.9,
        -48.3,
        -55.9,
        -57.7,
        -62.3,
        -66.1,
        -67.9,
        -65.7,
        -65.7,
        -64.1,
        -64.5,
        -64.3,
        -63.5,
        -64.3,
        -66.7,
        -67.1,
        -68.3,
    ],  # temperature values
    input_y_values=[
        977,
        899,
        849,
        823,
        810,
        802,
        771,
        720,
        693,
        604,
        587,
        567,
        559,
        539,
        505,
        492,
        461,
        453,
        447,
        433,
        424,
        402,
        398,
        383,
        312,
        297,
        273,
        264,
        252,
        215,
        208,
        182,
        175,
        158,
        155,
        153,
        149,
        145,
        142,
        140,
        130,
        121,
        109,
        104,
    ],  # pressure values
)

tempgraph = mv.mgraph(graph_line_colour="red", graph_line_thickness=4)

# Dewpoint definition
dwdata = mv.input_visualiser(
    input_x_values=[
        10.8,
        8.8,
        6.0,
        3.0,
        -20.6,
        -27.2,
        -23.6,
        -25.4,
        -12.0,
        -17.5,
        -14.5,
        -31.3,
        -32.5,
        -35.1,
        -45.5,
        -42.1,
        -30.1,
        -24.1,
        -23.1,
        -27.7,
        -38.5,
        -42.9,
        -57.9,
        -57.7,
        -67.3,
        -51.7,
        -55.1,
        -53.9,
        -59.3,
        -65.9,
        -71.7,
        -72.3,
        -76.1,
        -80.9,
        -81.7,
        -82.7,
        -85.1,
        -89.5,
        -93.3,
        -93.5,
        -94.3,
        -95.7,
        -96.1,
        -97.3,
    ],  # dewpoint values
    input_y_values=[
        977,
        899,
        849,
        823,
        810,
        802,
        771,
        720,
        693,
        604,
        587,
        567,
        559,
        539,
        505,
        492,
        461,
        453,
        447,
        433,
        424,
        402,
        398,
        383,
        312,
        297,
        273,
        264,
        252,
        215,
        208,
        182,
        175,
        158,
        155,
        153,
        149,
        145,
        142,
        140,
        130,
        121,
        109,
        104,
    ],  # pressure values
)

dwgraph = mv.mgraph(
    graph_line_colour="red", graph_line_style="dash", graph_line_thickness=4
)

# Wind definition
winddata = mv.input_visualiser(
    input_plot_type="xy_vectors",
    input_x_values=[1010, 1010, 1010, 1010, 1010, 1010, 1010, 1010],  # fixed values
    input_y_values=[989, 925, 850, 700, 500, 400, 300, 250],  # pressure values
    input_x_component_values=[
        -3.856726,
        -4.588612,
        1.91013,
        -2.871835e-08,
        11.27631,
        13.59462,
        19.92389,
        21.66577,
    ],  # u values
    input_y_component_values=[
        4.596267,
        6.553216,
        10.83289,
        8,
        4.104242,
        6.339274,
        1.743115,
        3.82026,
    ],  # v values
)

wind_plotting = mv.mwind(wind_field_type="flags", wind_flag_colour="evergreen")

# Define the thermodynamic view
view = mv.thermoview(type="tephigram", minimum_temperature=-110, maximum_temperature=30)

# Define the output plot file
mv.setoutput(mv.pdf_output(output_name="tephigram"))

# Plot the data onto the tephigram
mv.plot(view, tempdata, tempgraph, dwdata, dwgraph, winddata, wind_plotting)