Note
Click here to download the full example code
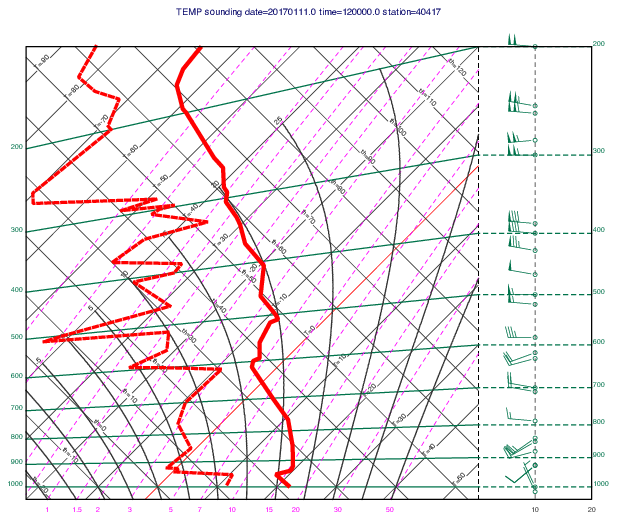
ODB - Tephigram
# (C) Copyright 2017- ECMWF.
#
# This software is licensed under the terms of the Apache Licence Version 2.0
# which can be obtained at http://www.apache.org/licenses/LICENSE-2.0.
#
# In applying this licence, ECMWF does not waive the privileges and immunities
# granted to it by virtue of its status as an intergovernmental organisation
# nor does it submit to any jurisdiction.
#

import metview as mv

# read db
filename = "temp.odb"
if mv.exist(filename):
    db = mv.read(filename)
else:
    db = mv.gallery.load_dataset(filename)

# station id
statid = "40417"

# run queries to get profile data
f_t = mv.odb_filter(
    odb_query="""select obsvalue, vertco_reference_1
	                   where varno=2 and statid='{}'""".format(
        statid
    ),
    odb_data=db,
)

f_q = mv.odb_filter(
    odb_query="""select obsvalue, vertco_reference_1
	                  where varno=7 and statid='{}'""".format(
        statid
    ),
    odb_data=db,
)

f_u = mv.odb_filter(
    odb_query="""select obsvalue, vertco_reference_1
	                  where varno=3 and statid='{}'""".format(
        statid
    ),
    odb_data=db,
)

f_v = mv.odb_filter(
    odb_query="""select obsvalue, vertco_reference_1
	                  where varno=4 and statid='{}'""".format(
        statid
    ),
    odb_data=db,
)

# define query for metadata
f_meta = mv.odb_filter(
    odb_query="""select lat@hdr as lat, lon@hdr as lon,
     andate, antime where statid='{}'""".format(
        statid
    ),
    odb_data=db,
)

# load temperature and humidity profiles into vectors
t = mv.values(f_t, "obsvalue@body")
p_t = mv.values(f_t, "vertco_reference_1@body")
q = mv.values(f_q, "obsvalue@body")
p_q = mv.values(f_q, "vertco_reference_1@body")

# compute dewpoint from specific humidity (q)
td = mv.dewpoint_from_specific_humidity(q, p_q)

# scale data for visualisation
t = t - 273.16
td = td - 273.16
p_t = p_t / 100
p_q = p_q / 100

# define t curve
t_vis = mv.xy_curve(t, p_t, "red", "solid", 8)

# define td curve
td_vis = mv.xy_curve(td, p_q, "red", "dash", 6)

# load wind profiles into vectors
u = mv.values(f_u, "obsvalue@body")
p = mv.values(f_u, "vertco_reference_1@body")
v = mv.values(f_v, "obsvalue@body")

# define wind x position in tephigram
wind_x_pos = [1010 for i in u]

# define wind visualisation
wp = mv.mwind(wind_field_type="flags", wind_flag_colour="evergreen")

wind_vis = mv.input_visualiser(
    input_plot_type="xy_vectors",
    input_x_values=wind_x_pos,
    input_y_values=p / 100,
    input_x_component_values=u,
    input_y_component_values=v,
)


# define the title
dd = mv.values(f_meta, "andate")[1]
tt = mv.values(f_meta, "antime")[1]

title = mv.mtext(
    text_line_1="TEMP sounding date={} time={} station={}".format(dd, tt, statid),
    text_font_size=0.4,
)

# define the view
view = mv.cartesianview(map_projection="tephigram", y_automatic_reverse="on")

# define the output plot file
mv.setoutput(mv.pdf_output(output_name="tephigram_odb"))

# generate plot
mv.plot(view, t_vis, td_vis, wind_vis, wp, title)