Note
Click here to download the full example code
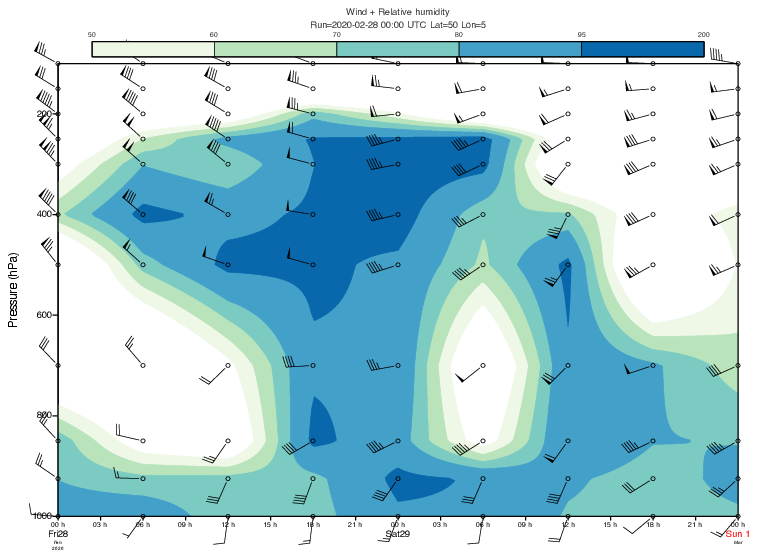
GRIB - Time Height Section Hovmoeller with Wind and Humidity
# (C) Copyright 2017- ECMWF.
#
# This software is licensed under the terms of the Apache Licence Version 2.0
# which can be obtained at http://www.apache.org/licenses/LICENSE-2.0.
#
# In applying this licence, ECMWF does not waive the privileges and immunities
# granted to it by virtue of its status as an intergovernmental organisation
# nor does it submit to any jurisdiction.
#

import metview as mv
import xarray as xr

# get data
use_mars = False

# get data from MARS
if use_mars:
    g = mv.retrieve(
        type="fc",
        levelist=[1000, 925, 850, 700, 500, 400, 300, 250, 200, 150, 100],
        param=["r", "u", "v"],
        date=20200228,
        time=0,
        step=[0, "to", 48, "by", 3],
        area=[55, -10, 45, 10],
        grid=[0.5, 0.5],
    )
# read data from GRIB file
else:
    filename = "vert_hov_r_wind.grib"
    if mv.exist(filename):
        g = mv.read(filename)
    else:
        g = mv.gallery.load_dataset(filename)

delta = 0.3
# The vertical hovmoeller module takes an area as an input.
# We define the location by shrinking down the area to a point,
# using a delta adjusted to the grid resolution (0.5x0.5 degrees)
loc = [50, 5]  # lat/lon
area = [loc[0] + delta, loc[1] - delta, loc[0] - delta, loc[1] + delta]  # N/W/S/E

# read relative humidity, u and v fields
r = mv.read(data=g, param="r")
u = mv.read(data=g, param="u")
v = mv.read(data=g, param="v")

# compute vertical hovmoeller data
hv_r = mv.mhovmoeller_vertical(data=r, area=area)
hv_u = mv.mhovmoeller_vertical(data=u, area=area)
hv_v = mv.mhovmoeller_vertical(data=v, area=area)

# combine u and v into the same data unit so that we can
# plot wind into the hovmoeller diagram.
mv.write("_hv_u.nc", hv_u)
mv.write("_hv_v.nc", hv_v)
ds_u = xr.open_dataset("_hv_u.nc")
ds_v = xr.open_dataset("_hv_v.nc")
ds = xr.merge([ds_u, ds_v])
ds.to_netcdf("_hv_wind.nc")
hv_wind = mv.read("_hv_wind.nc")

# define shading for relative humidity
r_cont = mv.mcont(
    legend="on",
    contour="off",
    contour_level_selection_type="level_list",
    contour_level_list=[50, 60, 70, 80, 95, 200],
    contour_label="off",
    contour_shade="on",
    contour_shade_colour_method="palette",
    contour_shade_method="area_fill",
    contour_shade_palette_name="colorbrewer_GnBu_5_r",
)

# define wind plotting style
wind_style = mv.mwind(
    wind_field_type="flags", wind_thinning_factor=1, wind_flag_colour="black"
)

# set up the hovmoeller vertical view as a cartesian view
horizontal_axis = mv.maxis(
    axis_type="date",
    axis_tick_label_height=0.4,
    axis_date_type="hours",
    axis_days_label_height=0.4,
    axis_hours_label="on",
    axis_hours_label_quality="high",
    axis_hours_label_height=0.3,
)

vertical_axis = mv.maxis(
    axis_title_text="Pressure (hPa)", axis_title_height=0.5, axis_tick_label_height=0.4
)

view = mv.cartesianview(
    x_automatic="on",
    x_axis_type="date",
    y_min=1000,
    y_max=100,
    horizontal_axis=horizontal_axis,
    vertical_axis=vertical_axis,
)

# the hovmoeller data is in a NetCDF format. We use
# netcdf visualisers to plot them into the cartesian view
nv_r = mv.netcdf_visualiser(
    netcdf_plot_type="xy_matrix",
    netcdf_x_variable="time",
    netcdf_y_variable="vertical",
    netcdf_value_variable="r",
    netcdf_data=hv_r,
)

nv_wind = mv.netcdf_visualiser(
    netcdf_plot_type="xy_matrix_vectors",
    netcdf_x_variable="time",
    netcdf_y_variable="vertical",
    netcdf_x_component_variable="u",
    netcdf_y_component_variable="v",
    netcdf_data=hv_wind,
)

# define legend
legend = mv.mlegend(legend_text_font_size=0.3, legend_text_colour="charcoal")

# define title
date = mv.base_date(r[0]).strftime("%Y-%m-%d %H:%M")
title = mv.mtext(
    text_font_size=0.4,
    text_lines=[
        "Wind + Relative humidity",
        f"Run={date} UTC Lat={loc[0]} Lon={loc[1]}",
    ],
    text_colour="charcoal",
)

# define the output plot file
mv.setoutput(mv.pdf_output(output_name="time_height_xs_wind"))

# generate plot
mv.plot(view, nv_r, r_cont, nv_wind, wind_style, legend, title)