mhovmoeller_vertical

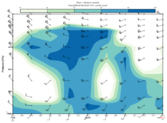
Generates a vertical Hovmoeller diagram data unit for a given geographical area for GRIB (Fieldset) input. The generated data can be used to display a two-dimensional graph with levels as one axis and time as the other.
The resulting data can be plotted (using a default visualisation and with the plot area based on the range of data values) or saved as a NetCDF data file using write().
If access to the computed values is not required, or for more control of the plotting, use mhovmoellerview().
Note
See also mhovmoeller_area(), mhovmoeller_line() and mhovmoeller_expand().
Note
This function performs the same task as the Hovmoeller Data icon in Metview’s user interface. It accepts its parameters as keyword arguments, described below.
- mhovmoeller_vertical(**kwargs)
Provides input for Hovemoeller diagrams derived at an input geographical location/area and on a set of levels.
- Parameters
input_mode ({"point", "nearest_gridpoint", "area"}, default: "area") –
Defines the horizontal data selection method:
”point”: the data is interpolated to the location specified by
point”nearest_gridpoint”: the nearest gridpoint to the location specified by
pointis extracted”area”: the values inside the
areaare averaged usingintegrate()
New in Metview version 5.16.0
point (list[number], default: [0, 0]) – Specifies the coordinates (as [lat, lon]) of the point for which the vertical Hovmoeller is computed. Enabled when
input_modeis “point” or “nearest_gridpoint”. New in Metview version 5.16.0area (list[number], default: [30, -30, -30, 30]) – Specifies the coordinates of the area (as [north, west, south, east]) over which the Hovmoeller diagram is calculated. Enabled when
input_modeis “area”.area_statistics ({"mean", "minimum", "maximum", "stdev", "variance", "median"}, default: "mean") – Specifies the type of computation performed for the
area. For “mean”, “stdev” or “variance” the aggregation is weighted by the cosine of the latitudes. Enabled wheninput_modeis “area”. New in Metview version 5.18.0data (
Fieldset) – Specifies the input GRIB data for the Hovmeller diagram.datamust contain a time-series of a single meteorological variable on a latitude-longitude or Gaussian grid, on a set of vertical levels. Ifdatais specified on ECMWF model levels andvertical_level_typeis “pressure”datamust also contain an Logarithm of Surface Pressure (LNSP) field (seelnsp_param) for each step, otherwise the pressure on the model levels cannot be computed.vertical_level_type ({"as_in_data", "pressure", "user"}, default: "as_in_data") –
Specifies the output vertical level type:
”as_in_data”: the level type of
datais used. In this casetop_levelandbottom_levelmust always be set carefully, since their default values are set for pressure in hPa.”pressure”: indicates that the
datais defined on ECMWF model levels and the output vertical coordinate should be pressure in hPa. When this option is selected the input data must contain the corresponding Logarithm of Surface Pressure (LNSP) fields, unless a fixed surface pressure is used (seeuse_fixed_surface_pressure).”user”: the vertical coordinates (both input and output) are defined by the fields of
vertical_coordinate_param. In this casetop_levelandbottom_levelmust always be set carefully, since their default values are set for pressure in hPa. New in Metview version 5.16.0
lnsp_param (number, default: 152) – Specifies the ecCodes paramId used to identify the Logarithm of Surface Pressure (LNSP) in the input data. Enabled when
vertical_level_typeis “pressure”.use_fixed_surface_pressure ({"on", "off"}, default: "off") – When it is “on” a fixed surface pressure value will be used in the computations and no LNSP fields have to be specified. Enabled when
vertical_level_typeis “pressure”. New in Metview version 5.17.0fixed_surface_pressure (number, default: 1013.25) – Specify the fixed surface pressure value in hPa when
use_fixed_surface_pressureis “on”. New in Metview version 5.17.0vertical_coordinate_param (number) – Specifies the ecCodes paramId used to identify the vertical coordinate fields in the input data. Enabled when
vertical_level_typeis “user”. New in Metview version 5.16.0vertical_coordinate_extrapolate ({"on", "off"}, default: "off") – Performs an extrapolation for the
top_levelandbottom_levelwhen the output vertical level range does not contain these levels. The purpose is to avoid blank areas in the plot near the bottom ot top. Only used whenvertical_level_typeis “pressure” or “user”. New in Metview version 5.16.0vertical_coordinate_extrapolate_mode ({"constant", "linear"}, default: "constant") – Specifies the extrapolation technique. In “constant” mode the values on the nearest input levels are copied onto the target extrapolated levels. In “linear” mode a linear extrapolation is performed using the nearest two input levels. Enabled when
vertical_coordinate_extrapolateis “on”. New in Metview version 5.16.0vertical_coordinate_extrapolate_fixed_sign ({"on", "off"}, default: "on") – When
vertical_coordinate_extrapolate_modeis “on” it controls whether the extrapolated values can differ in sign from the values on the nearest input levels. When it is “on” it prevents e.g. wind components to change sign due to extrapolation. New in Metview version 5.16.0bottom_level (number, default: 1015.0) – Specifies the lower (closest to the surface) limit of the Hovmoeller data in the units of the vertical coordinates. Only levels in the range defined by
top_levelandbottom_levelare included in the output data. An extra level on either side of this range is also added. Enabled whenvertical_level_typeis “pressure” or “param”.top_level (number, default: 0.01) – Specifies the upper (furthest from the surface) limit of the Hovmoeller data in the units of the vertical coordinates. Only levels in the range defined by
top_levelandbottom_levelare included in the output data. An extra level on either side of this range is also added. Enabled whenvertical_level_typeis “pressure” or “param”.
- Return type