Note
Click here to download the full example code
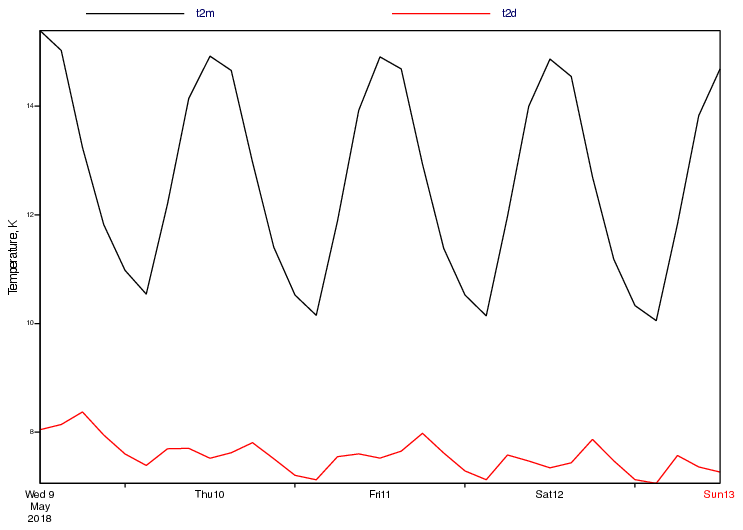
GRIB - Time Series
# (C) Copyright 2017- ECMWF.
#
# This software is licensed under the terms of the Apache Licence Version 2.0
# which can be obtained at http://www.apache.org/licenses/LICENSE-2.0.
#
# In applying this licence, ECMWF does not waive the privileges and immunities
# granted to it by virtue of its status as an intergovernmental organisation
# nor does it submit to any jurisdiction.
#

import metview as mv

# read a set of t2m and t2d forecast steps from a GRIB file
filename = "t2m_td.grib"
if mv.exist(filename):
    both_t = mv.read(filename)
else:
    both_t = mv.gallery.load_dataset(filename)

# filter the t2m and dewpoint t into separate fieldsets (and K->C)
t2m = mv.read(data=both_t, param="2t") - 273.15
t2d = mv.read(data=both_t, param="2d") - 273.15

# for each temperature type, get the weighted averages over an area
# - returns a list of numbers, one for each field
area = [75, -12.5, 35, 42.5]  # N,W,S,E
t2m_int = mv.integrate(t2m, area)
t2d_int = mv.integrate(t2d, area)

# get the valid times for each field
times_t2m = mv.valid_date(t2m)
times_t2d = mv.valid_date(t2d)

# set up the Cartesian view to plot into
# including customised axes so that we can change the size
# of the labels and add titles
haxis = mv.maxis(
    axis_type="date",
    axis_years_label_height=0.45,
    axis_months_label_height=0.45,
    axis_days_label_height=0.45,
)

vaxis = mv.maxis(axis_title_text="Temperature, K", axis_title_height=0.5)

ts_view = mv.cartesianview(
    x_automatic="on",
    x_axis_type="date",
    y_automatic="on",
    horizontal_axis=haxis,
    vertical_axis=vaxis,
)

# create the curves for both parameters
curve_2t = mv.input_visualiser(
    input_x_type="date", input_date_x_values=times_t2m, input_y_values=t2m_int
)

curve_2d = mv.input_visualiser(
    input_x_type="date", input_date_x_values=times_t2d, input_y_values=t2d_int
)

# set up visual styling for each curve
common_graph = {"graph_line_thickness": 2, "legend": "on"}
graph_2t = mv.mgraph(common_graph, graph_line_colour="black", legend_user_text="t2m")
graph_2d = mv.mgraph(common_graph, graph_line_colour="red", legend_user_text="t2d")

# customise the legend
legend = mv.mlegend(legend_display_type="disjoint", legend_text_font_size=0.5)

# define the output plot file
mv.setoutput(mv.pdf_output(output_name="time_series"))

# plot everything into the Cartesian view
mv.plot(ts_view, curve_2t, graph_2t, curve_2d, graph_2d, legend)