Note
Click here to download the full example code
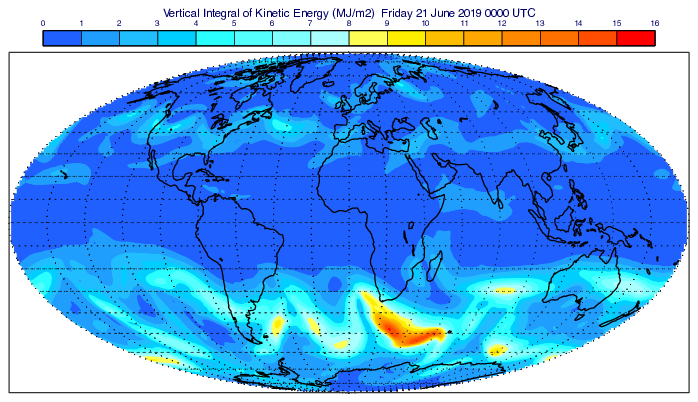
GRIB - Vertical Integral
# (C) Copyright 2017- ECMWF.
#
# This software is licensed under the terms of the Apache Licence Version 2.0
# which can be obtained at http://www.apache.org/licenses/LICENSE-2.0.
#
# In applying this licence, ECMWF does not waive the privileges and immunities
# granted to it by virtue of its status as an intergovernmental organisation
# nor does it submit to any jurisdiction.
#

import metview as mv

# getting data
use_mars = False

# getting forecast data from MARS
if use_mars:
    # get u/v on all the model levels
    g = mv.retrieve(
        levtype="ml",
        levelist=[1, "to", 137],
        param=["u", "v", "lnsp"],
        date=20190621,
        time=0,
        grid=[1, 1],
    )
# read data from file
else:
    filename = "uv_ml.grib"
    if mv.exist(filename):
        g = mv.read(filename)
    else:
        g = mv.gallery.load_dataset(filename)

# extract parameters
u = mv.read(data=g, param="u")
v = mv.read(data=g, param="v")
lnsp = mv.read(data=g, param="lnsp")

# compute kinetic energy (for unit mass, J/kg units)
ke = (u * u + v * v) / 2

# compute hydrostatic vertical integral
res = mv.univertint(lnsp, ke)

# scale results for plotting (J/m2 -> MJ/m2)
res = res * 1e-6

# define contour shading
cont = mv.mcont(
    legend="on",
    contour="off",
    contour_level_selection_type="interval",
    contour_max_level=16,
    contour_min_level=0,
    contour_interval=1,
    contour_label="off",
    contour_shade="on",
    contour_shade_colour_method="palette",
    contour_shade_method="area_fill",
    contour_shade_palette_name="norway_blue_red_16",
)

# define view
coastlines = mv.mcoast(
    map_coastline_thickness=2,
    map_coastline_resolution="low",
    map_grid_line_style="dot",
    map_label="off",
)

view = mv.geoview(map_projection="mollweide", coastlines=coastlines)

# define title
title = mv.mtext(
    text_lines="Vertical Integral of Kinetic Energy (MJ/m2)  <grib_info key='valid-date'/>",
    text_font_size=0.5,
)

# define legend
legend = mv.mlegend(legend_text_font_size=0.35)

# define the output plot file
mv.setoutput(mv.pdf_output(output_name="vertical_integral"))

# generate plot
mv.plot(view, res, cont, title, legend)