Note
Click here to download the full example code
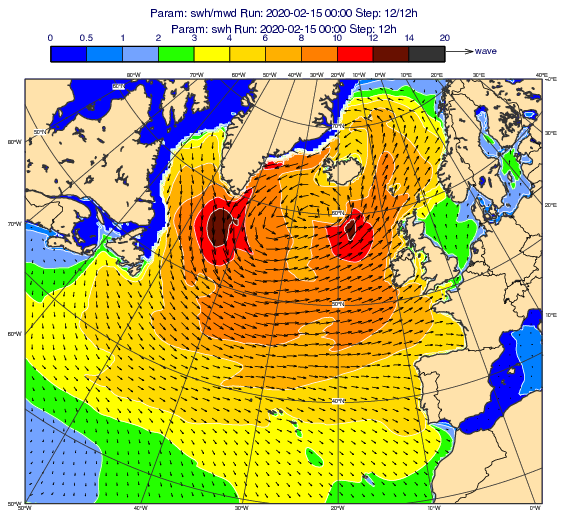
GRIB - Mean Wave Direction and Significant Wave Height
# (C) Copyright 2017- ECMWF.
#
# This software is licensed under the terms of the Apache Licence Version 2.0
# which can be obtained at http://www.apache.org/licenses/LICENSE-2.0.
#
# In applying this licence, ECMWF does not waive the privileges and immunities
# granted to it by virtue of its status as an intergovernmental organisation
# nor does it submit to any jurisdiction.
#

import metview as mv

# getting data
use_mars = False

# getting forecast data from MARS
if use_mars:
    g = mv.retrieve(
        type="fc",
        stream="wv",
        param=["mwd", "swh"],
        date=20200215,
        time=0,
        step=12,
        levtype="sfc",
        area=[90, -90, 20, 40],
        grid=[0.2, 0.2],
    )
# read data from file
else:
    filename = "wave.grib"
    if mv.exist(filename):
        g = mv.read(filename)
    else:
        g = mv.gallery.load_dataset(filename)

# extract significant wave height and mean wave direction
swh = mv.read(data=g, param="swh")
mwd = mv.read(data=g, param="mwd")

# define vector field for plotting, the magnitude of the
# vectors will be the wave height
g_vec = mv.grib_vectors(type="polar_field", intensity=swh, direction=mwd)

# turn missing values to 0 in swh so that no gap should appear
# around the coastlines
swh = mv.nobitmap(swh, 0)

# define vector plotting
vec_style = mv.mwind(
    wind_thinning_factor=6,
    legend="on",
    wind_legend_text="    wave",
    wind_arrow_min_speed=0,
    wind_arrow_max_speed=20,
    wind_arrow_calm_indicator="on",
    wind_arrow_calm_below=0.01,
    wind_arrow_colour="black",
    wind_arrow_thickness=1,
    wind_arrow_unit_velocity=20,
)

# define shading for wave height
cont = mv.mcont(contour_automatic_setting="ecmwf", legend="on")

# define coastlines with land shading but no sea shading.
# We set map_layer_mode="foreground" to make the
# land shading appear on top of the contour plot!
coast = mv.mcoast(
    map_coastline_resolution="medium",
    map_coastline_colour="charcoal",
    map_coastline_thickness=2,
    map_coastline_land_shade="on",
    map_coastline_land_shade_colour="cream",
    map_coastline_sea_shade="off",
    map_boundaries="on",
    map_boundaries_colour="black",
    map_boundaries_thickness=1,
    map_grid_colour="charcoal",
    map_grid_latitude_increment=10,
    map_grid_longitude_increment=10,
    map_layer_mode="foreground",
)

# define map view
view = mv.geoview(
    area_mode="name",
    area_name="north_atlantic",
    coastlines=coast,
)

# define legend
legend = mv.mlegend(legend_text_font_size=0.4)

# define title
title = mv.mtext(
    text_lines=[
        "Param: <grib_info key='shortName'/> Run: <grib_info key='base-date' format='%Y-%m-%d %H:%M'/> Step: <grib_info key='step'/>h"
    ],
    text_font_size=0.5,
)

# define the output plot file
mv.setoutput(mv.pdf_output(output_name="wave_direction_and_height"))

# generate plot
mv.plot(view, swh, cont, g_vec, vec_style, title, legend)