Note
Click here to download the full example code
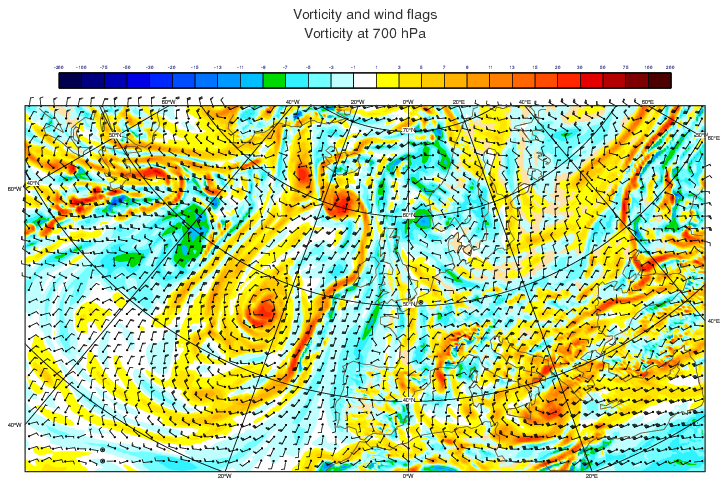
GRIB - Vorticity and Wind
# (C) Copyright 2017- ECMWF.
#
# This software is licensed under the terms of the Apache Licence Version 2.0
# which can be obtained at http://www.apache.org/licenses/LICENSE-2.0.
#
# In applying this licence, ECMWF does not waive the privileges and immunities
# granted to it by virtue of its status as an intergovernmental organisation
# nor does it submit to any jurisdiction.
#

# --------------------------------------------------------------------------------
# Demonstrates how to combine a contour field and a wind field into a
# single plot (inspired by an ecCharts product).
# --------------------------------------------------------------------------------

import metview as mv

# read input grib files
filename = "vorticity.grib"
if mv.exist(filename):
    my_vorticity = mv.read(filename)
else:
    my_vorticity = mv.gallery.load_dataset(filename)

filename = "wind.grib"
if mv.exist(filename):
    my_uvwind = mv.read(filename)
else:
    my_uvwind = mv.gallery.load_dataset(filename)

# set up the contour for vorticity field
my_contour = mv.mcont(
    contour_level_selection_type="level_list",
    contour_level_list=[
        -200.0,
        -100.0,
        -75.0,
        -50.0,
        -30.0,
        -20.0,
        -15.0,
        -13.0,
        -11.0,
        -9.0,
        -7.0,
        -5.0,
        -3.0,
        -1.0,
        1.0,
        3.0,
        5.0,
        7.0,
        9.0,
        11.0,
        13.0,
        15.0,
        20.0,
        30.0,
        50.0,
        75.0,
        100.0,
        200.0,
    ],
    contour_shade="on",
    contour_shade_colour_method="list",
    contour_shade_method="area_fill",
    contour_shade_colour_list=[
        "rgb(0,0,0.3)",
        "rgb(0,0,0.5)",
        "rgb(0,0,0.7)",
        "rgb(0,0,0.9)",
        "rgb(0,0.15,1)",
        "rgb(0,0.3,1)",
        "rgb(0,0.45,1)",
        "rgb(0,0.6,1)",
        "rgb(0,0.75,1)",
        "rgb(0,0.85,)",
        "rgb(0.2,0.95,1)",
        "rgb(0.45,1,1)",
        "rgb(0.75,1,1)",
        "none",
        "rgb(1,1,0)",
        "rgb(1,0.9,0)",
        "rgb(1,0.8,0)",
        "rgb(1,0.7,0)",
        "rgb(1,0.6,0)",
        "rgb(1,0.5,0)",
        "rgb(1,0.4,0)",
        "rgb(1,0.3,0)",
        "rgb(1,0.15,0)",
        "rgb(0.9,0,0)",
        "rgb(0.7,0,0)",
        "rgb(0.5,0,0)",
        "rgb(0.3,0,0)",
    ],
    legend="on",
    contour_hilo="off",
    contour="off",
    contour_highlight="off",
    contour_label="off",
)

# set up the wind plotting
my_wind = mv.mwind(
    wind_legend_text="BLACK WIND FLAGS (IN KNOTS)",
    wind_arrow_unit_velocity=10.00,
    wind_flag_origin_marker="dot",
    wind_thinning_factor=10,
    wind_flag_length=0.30,
    wind_flag_origin_marker_size=0.10,
    wind_field_type="flags",
    wind_flag_colour="black",
)

# set up the coastlines
my_coast = mv.mcoast(
    map_coastline_sea_shade="on",
    map_coastline_land_shade_colour="cream",
    map_grid="on",
    map_coastline_land_shade="on",
    map_coastline_sea_shade_colour="white",
    map_label="on",
    map_coastline_colour="tan",
)

# set up the geographical view
my_view = mv.geoview(
    map_area_definition="corners",
    map_projection="polar_stereographic",
    area=[21.51, -37.27, 51.28, 65.00],
    coastlines=my_coast,
)

# set up the title
my_title = mv.mtext(
    text_font_size=0.60,
    text_lines=["Vorticity and wind flags", "Vorticity at 700 hPa", ""],
    text_colour="charcoal",
)


# define the output plot file
mv.setoutput(mv.pdf_output(output_name="wind4"))

# plot the data onto the map
mv.plot(my_view, my_vorticity, my_contour, my_uvwind, my_wind, my_title)