Part 1 - Intro
Setup
Start Metview
Log onto a machine and start a new terminal. If at ECMWF, start Metview by simply typing on the command line:
module swap metview/new
metview &
You will see something like this:
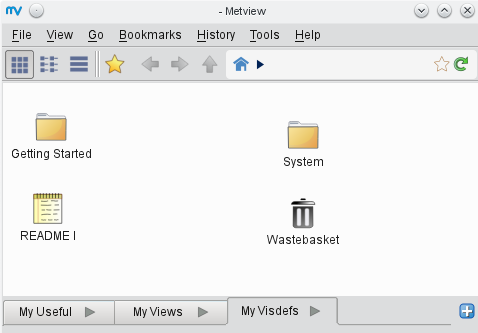
Right-click on some empty space and select Create New Folder - call it intro.
Grab a GRIB file (and the solutions)
Metview’s home folder maps to $HOME/metview, so we will copy some data into our new folder (we could also create symlinks).
If at ECMWF, do the following:
cp -r /home/graphics/cgx/tutorials/metview_intro $HOME/metview/
Otherwise, download the tarball from the parent page and uncompress it into the $HOME/metview folder.
Within Metview’s GUI, navigate into the new metview_intro folder and then into the 1_intro folder. Notice the new GRIB icon called t_fc.grib.
Simple visualisation
To visualise this data, right-click on its icon and select visualise. You will now see the Display Window. Its toolbars can all be moved, docked, undocked and hidden to suit your preferences. The plot uses a simple default styling. Try the following features from the toolbar:
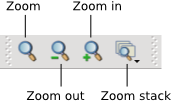
Zoom |
|
|
Magnifier |

|
See ‘Magnifier’ note below |
Cursor data |

|
See ‘Cursor data’ note below |

|
||
Animation |
|
See ‘Animation’ note below |
|
||
Layer metadata |
|
See ‘Layer metadata’ note below |
Magnifier - Toggles the magnifier tool on and off. Unlike Zoom, this is a purely graphical enlargement of the plot. It is used mainly to inspect small text such as contour labels. The magnifying glass can be moved and resized using the mouse, and the magnification scale on its left-hand side can also be adjusted.
Cursor data - Toolbar toggles a panel which follows the mouse cursor. Click with the left mouse button to ‘dock’ or ‘undock’ this floating panel. It provides information about the data point closest to the mouse cursor.
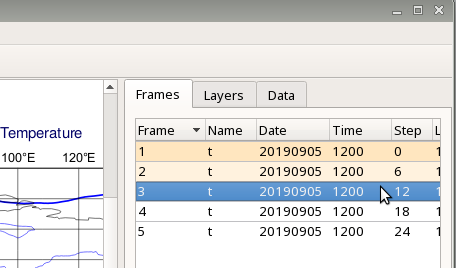
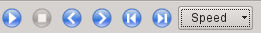
Animation - The Frames tab to the right of the plot shows the set of fields contained in the GRIB file. You can move between fields by clicking within this tab, by using the animation control buttons or by using the cursor keys. Note that each plot is computed and cached only when you select a field.
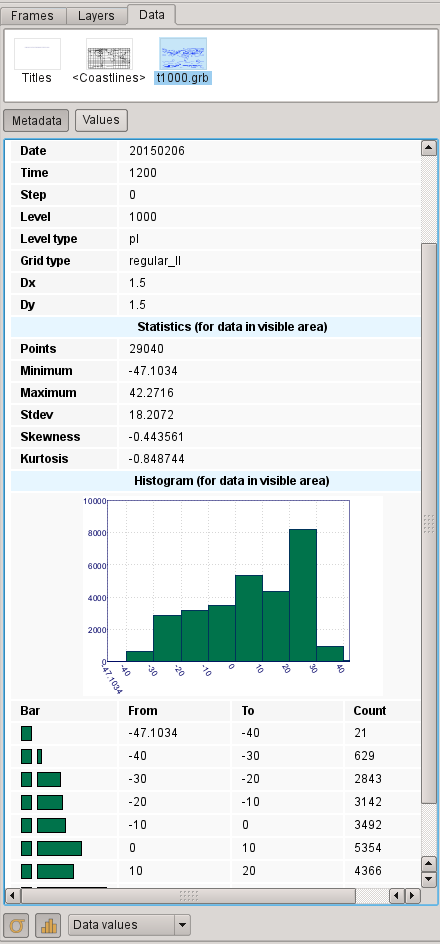
Layer metadata - Select the Data tab in the right-hand panel. This reveals a page of meta-data for the visible data in the current layer, including a histogram.
Retrieve data from MARS
Create a new icon - select Mars Retrieval from the list. Edit the icon and set the following parameters to retrieve relative humidity on a 1x1 degree grid on the standard MARS pressure levels:
Parameter |
Value |
Param |
R |
Grid |
1/1 |
Save the icon, then right-click and Execute it. The icon’s title should change colour like this:

|

|

|
Black - not started |
Orange - retrieving / processing |
Green - result is ready |
Your Mars Retrieval icon now acts as a proxy to the data it has retrieved - you can right-click and Visualise it for instance. The data for this icon is cached as long as the title is green, and will not be re-retrieved until you either restart Metview or edit or rename the icon.
Icon management: rename this icon to get_r. Now make a duplicate of the icon and rename that one to get_t. Edit this new one, change Param to T, save the icon and now directly right-click and Visualise it. The Execute step is performed automatically for you because the data has not yet been retrieved.
Right-click on get_t and choose Save Result to save the GRIB data as a file called my_t.grib in the current directory. There is normally no need to do this unless you plan to use the data outside of this Metview session.
Putting it into a script
Right-click somewhere on the Metview desktop and select Create New Python Script.
Edit the new icon to bring up Metview’s code editor.
You may have to re-arrange your windows slightly, but drop the get_t icon into the code editor.
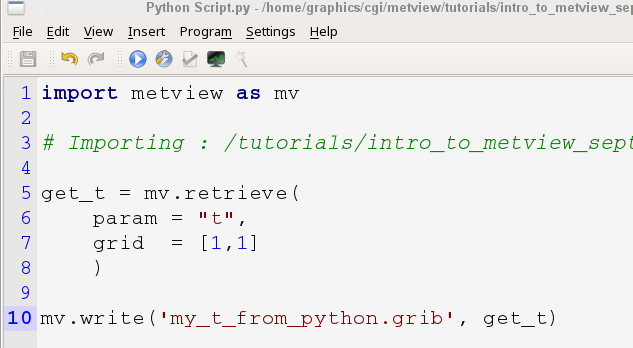
The Python equivalent code is generated, and the result is stored in a variable with the same name as the icon (get_t).
Use the write() command as shown in the screenshot, then run the script using the Run button in the editor. Your new GRIB file should appear! You should also be able to run this from the command line the same as any Python script.
If you have extra time…
Look at the North pole

Right-click somewhere on the Metview desktop and select Create New Icon. From the list, select Geographical View and click OK. Right-click the new icon and choose Edit. Set the following parameter:
Parameter |
Value |
Map Projection |
Polar Stereographic |
and click OK. Now right-click and Visualise this icon. Drop the GRIB file icon (t_fc.grib) into the Display Window to view it in this projection. Zoom controls etc work as normal. You can also right-click and Visualise the GRIB file and then drop the Geographic View icon into the Display Window to apply that view to the data.
The Geographical View icon can also be used to specify specific view regions so that exactly the same area is viewed each time.