mvl_geoline
- mvl_geoline(lat1, lon1, lat2, lon2, incrm)
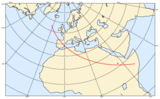
Plots a straight line linearly sampled in lat-lon onto any map projections.
- Parameters
lat1 (number) – start latitude of the line
lon1 (number) – start longitude of the line
lat2 (number) – end latitude of the line
lon2 (number) – end longitude of the line
incr (number) – increment in degrees for the line segments to make up the line
- Return type
Internally, the line is split into a number of segments and the returned result is an
input_visualiser()object which can be passed toplot()along with an optionalmgraph()object.