Note
Click here to download the full example code
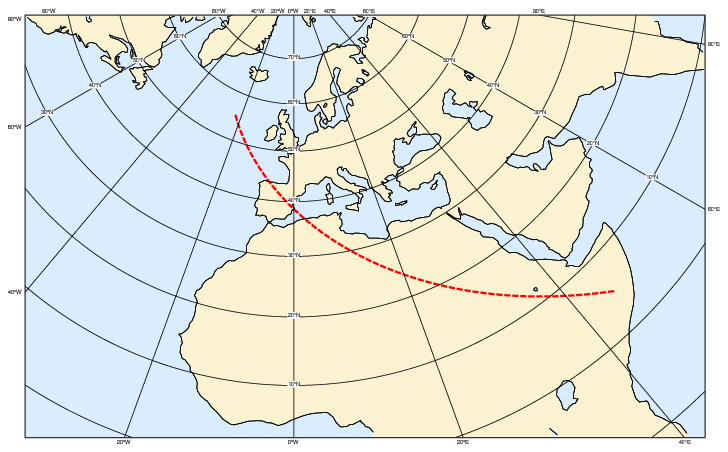
Geoline on Map
# (C) Copyright 2017- ECMWF.
#
# This software is licensed under the terms of the Apache Licence Version 2.0
# which can be obtained at http://www.apache.org/licenses/LICENSE-2.0.
#
# In applying this licence, ECMWF does not waive the privileges and immunities
# granted to it by virtue of its status as an intergovernmental organisation
# nor does it submit to any jurisdiction.
#

# ---------------------------------------------------------------
# Demonstrates how to plot a line on any map projection using
# function mvl_geoline.
# ---------------------------------------------------------------

import metview as mv

# set up the shaded coastlines
land_sea_shade = mv.mcoast(
    map_coastline_land_shade="on",
    map_coastline_land_shade_colour="RGB(0.98,0.95,0.82)",
    map_coastline_sea_shade="on",
    map_coastline_sea_shade_colour="RGB(0.85,0.93,1)",
)

# define the geographic view
view = mv.geoview(
    map_projection="polar_stereographic",
    map_area_definition="corners",
    area=[-5, -30, 10, 84],  # S,W,N,E
    coastlines=land_sea_shade,
)

# create a geoline broken into 1-degree segments
line_increment_in_degrees = 1

# coordinates of line end-points  given as lat1,lon1,lat2,lon2
geoline = mv.mvl_geoline(55, -22, 5, 45, line_increment_in_degrees)

# define the plotting attributes for the line
line_visdef = mv.mgraph(
    graph_line_colour="red", graph_line_thickness="4", graph_line_style="dash"
)


# define the output plot file
mv.setoutput(mv.pdf_output(output_name="geoline_on_map"))

# plot the line on the map
mv.plot(view, geoline, line_visdef)