Note
Click here to download the full example code
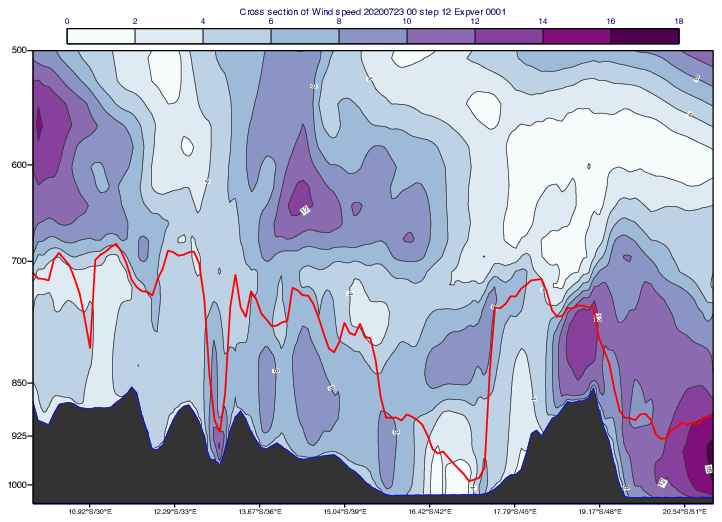
Cross Section with Orography and Boundary Layer Height
# (C) Copyright 2017- ECMWF.
#
# This software is licensed under the terms of the Apache Licence Version 2.0
# which can be obtained at http://www.apache.org/licenses/LICENSE-2.0.
#
# In applying this licence, ECMWF does not waive the privileges and immunities
# granted to it by virtue of its status as an intergovernmental organisation
# nor does it submit to any jurisdiction.
#

import metview as mv

# get data
use_mars = False
if use_mars:
    # get data from MARS
    ret_core = {
        "date": "20200723",
        "time": 0,
        "area": [-8, 25, -25, 55],
        "grid": [0.2, 0.2],
    }

    # forecast fields on all the model levels (bottom=ML-137, top=ML-1)
    # Note= log surface pressure (lnsp) is defined on ML-1!
    fs_ml = mv.retrieve(
        **ret_core,
        type="fc",
        levtype="ml",
        levelist=[1, "TO", 137],
        step=12,
        param=["t", "q", "u", "v", "lnsp"]
    )

    # surface geopotential is available in
    # the analysis only! It is available on ML-1!
    zs = mv.retrieve(**ret_core, type="an", levtype="ml", levelist=1, param="z")

    # boundary layer height forecast
    blh = mv.retrieve(**ret_core, type="fc", levtype="sfc", param="blh", step=12)
else:
    # read data from GRIB file
    filename = "xs_blh.grib"
    if mv.exist(filename):
        fs_in = mv.read(filename)
    else:
        fs_in = mv.gallery.load_dataset(filename)
    fs_ml = mv.read(data=fs_in, levtype="ml")
    zs = mv.read(data=fs_ml, param="z")
    blh = mv.read(data=fs_in, param="blh")

# extract ml data
t = mv.read(data=fs_ml, param="t")
q = mv.read(data=fs_ml, param="q")
lnsp = mv.read(data_ml=fs_ml, param="lnsp")
u = mv.read(data=fs_ml, param="u")
v = mv.read(data=fs_ml, param="v")

# define cross section line
line = [-10, 28, -21, 52]

# -------------------------------------------
# Generate cross section data for wind speed
# -------------------------------------------

# compute wind speed and set its paramId
sp = mv.sqrt(u * u + v * v)
sp = mv.grib_set_long(sp, ["paramId", 10])

# compute cross section data for sp
# (this is a NetCDF object)
sp_fs = sp
sp_fs.append(lnsp)
xs_sp = mv.mcross_sect(data=sp_fs, line=line)

# -------------------------------------------
# Generate curve for BL height
# -------------------------------------------

# compute geopotential on model levels
z = mv.mvl_geopotential_on_ml(t, q, lnsp, zs)

# compute pressure on model levels
p = mv.unipressure(lnsp)

# interpolate pressure to the height of the BL
p_blh = mv.ml_to_hl(p, z, zs, blh, "ground", "linear")

# define a curve object (in hPa) for the pressure of BL height
p_blh_curve = mv.xs_build_curve(xs_sp, p_blh / 100, "red", "solid", 3)

# define shading for wind speed using a palette
sp_cont = mv.mcont(
    legend="on",
    contour_line_colour="charcoal",
    contour_highlight="off",
    contour_level_selection_type="interval",
    contour_max_level=18,
    contour_min_level=0,
    contour_interval=2,
    contour_shade="on",
    contour_shade_colour_method="palette",
    contour_shade_method="area_fill",
    contour_shade_palette_name="m_purple_9",
)

# define vertical axis
vertical_axis = mv.maxis(
    axis_orientation="vertical",
    axis_type="position_list",
    axis_tick_position_list=[1000, 925, 850, 700, 600, 500],
    axis_tick_label_height=0.4,
)

# define cross section in log pressure (hPa)
xs_view = mv.mxsectview(
    line=line,
    top_level=500,
    bottom_level=1030,
    vertical_scaling="log",
    vertical_axis=vertical_axis,
)

# define orography area shading
orog_graph = mv.mgraph(graph_type="area", graph_shade_colour="charcoal")

# define legend
legend = mv.mlegend(legend_text_font_size=0.35)

# define title
title = mv.mtext(text_font_size=0.4)

# define the output plot file
mv.setoutput(mv.pdf_output(output_name="cross_section_orog_and_blh"))

# generate plot
mv.plot(xs_view, xs_sp, sp_cont, orog_graph, p_blh_curve, legend, title)