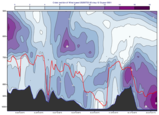
xs_build_curve
- xs_build_curve(xs_d, fs, colour, style, thickness)
Convenience function to build a curve to be plotted in a
mxsectview()with the givencolour,styleandthickness.- Parameters
xs_d (
mcross_sect()) – cross section data objectfs (
Fieldset) – the data from which the curve values will be extractedcolour (str) – the colour of the curve
style (str) – the line style of the curve. The possible values are “solid”, “dash”, “dot”, “chain_dot”, “chain_dash”.
thickness (number) – the thickness of the curve
- Return type
list of
input_visualiser()andmgraph()
The curve values are extracted from the first field in
fsand they must be in the same units as the vertical axis of the cross section. The cross section definition itself is taken fromxs_d.xs_build_curve()returns a list containing aninput_visualiser()and anmgraph(), which can be directly used inplot().

